
Online Laser Cutting Trend Report – Q4 2019
This quarterly report is for customers, suppliers and digital manufacturing industry trends analysts to learn more about online laser cutting.
It’s the only report of its kind, with real world data from Ponoko, an online laser cutting pioneer visited by 1,000,000 people per year.
This is our fourth report for 2019. Let’s see what’s changed:
Laser Technique
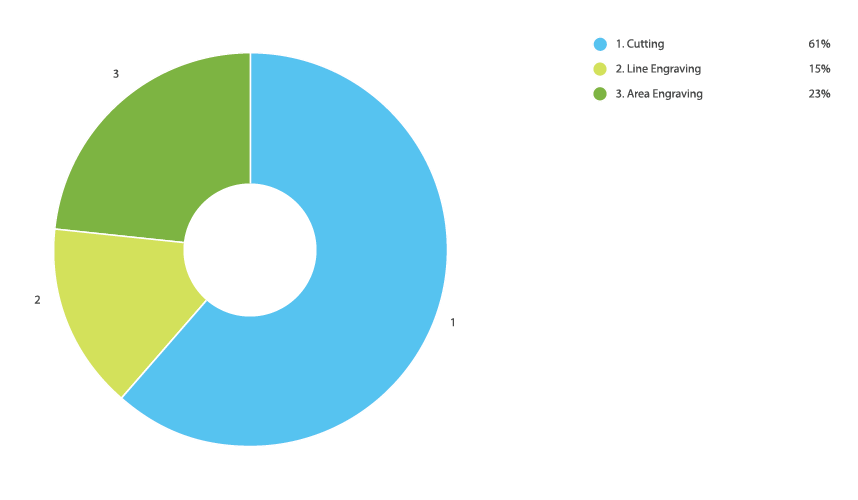
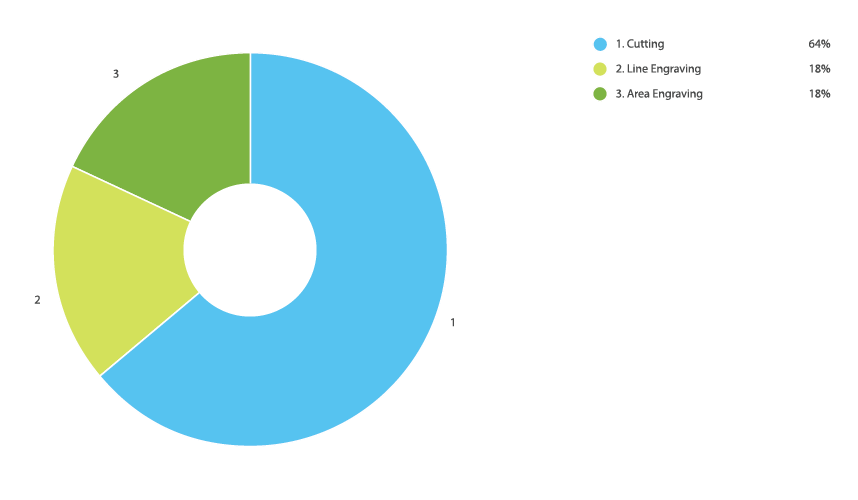
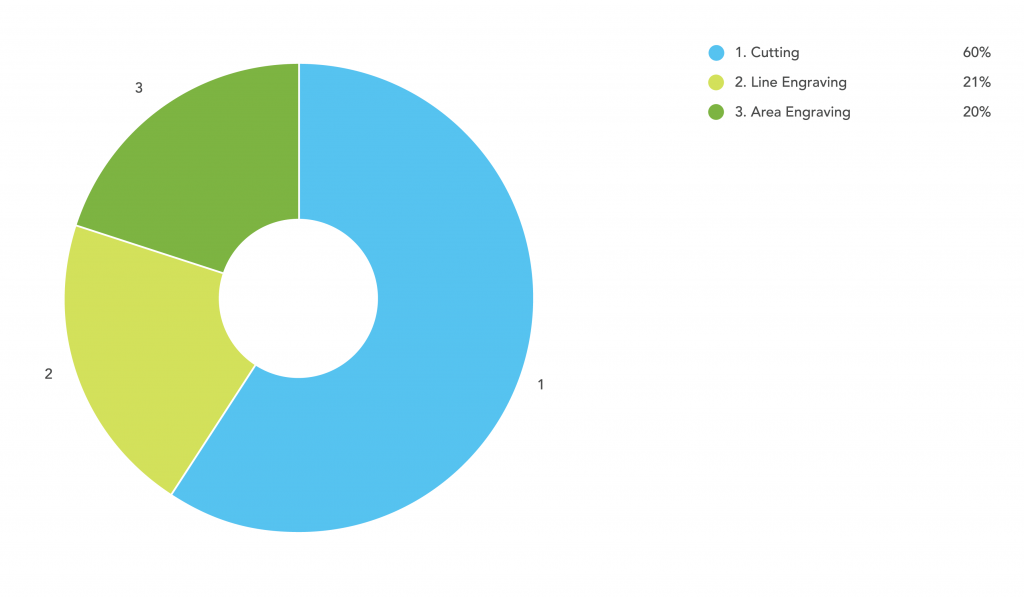
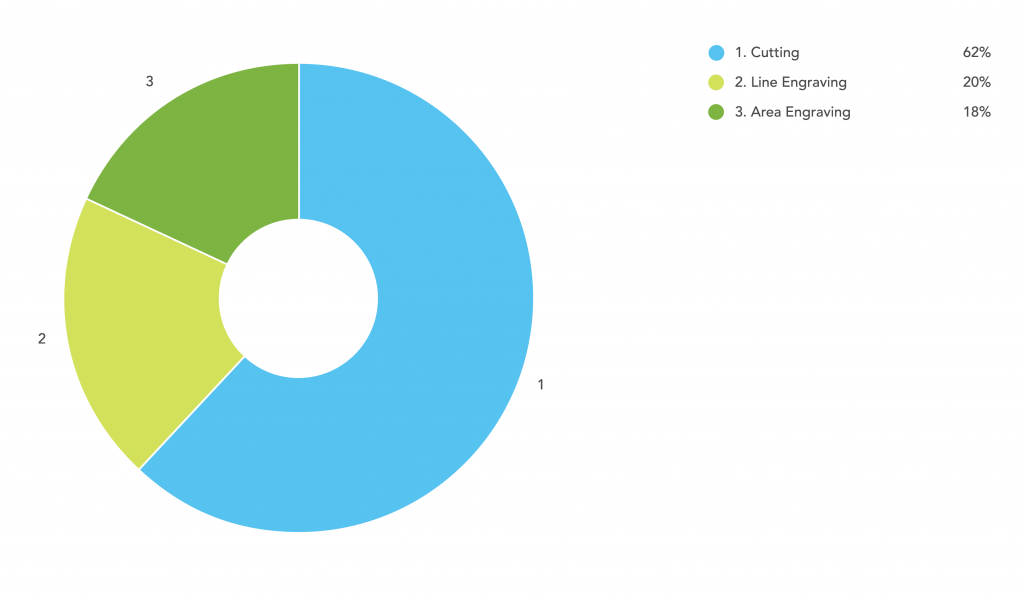
Most Used Laser Technique
Both laser cutting and laser engraving soften in the final quarter of the year with area engraving up by 5%.
Materials
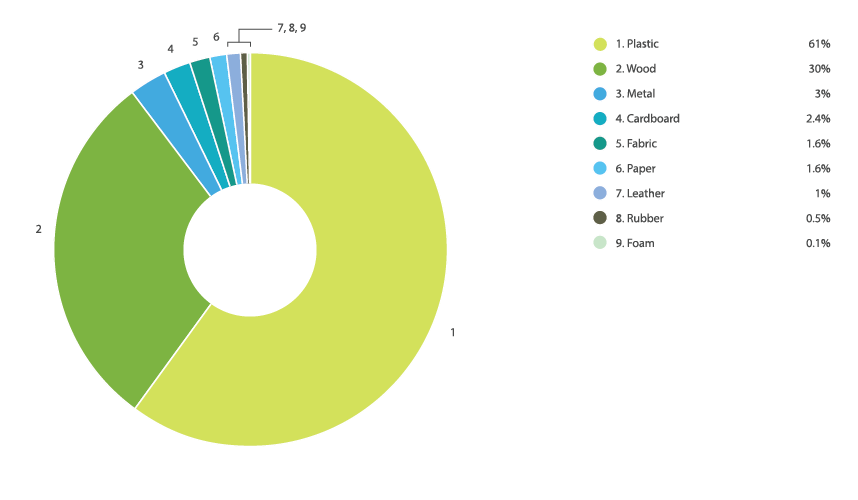
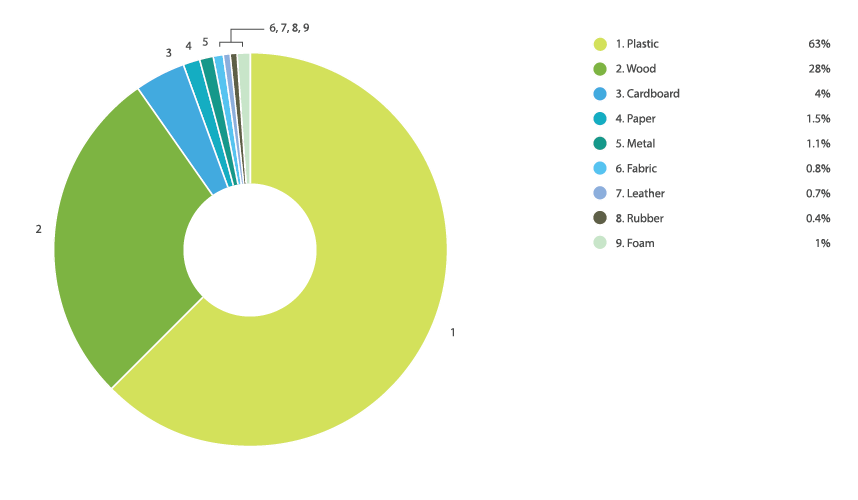
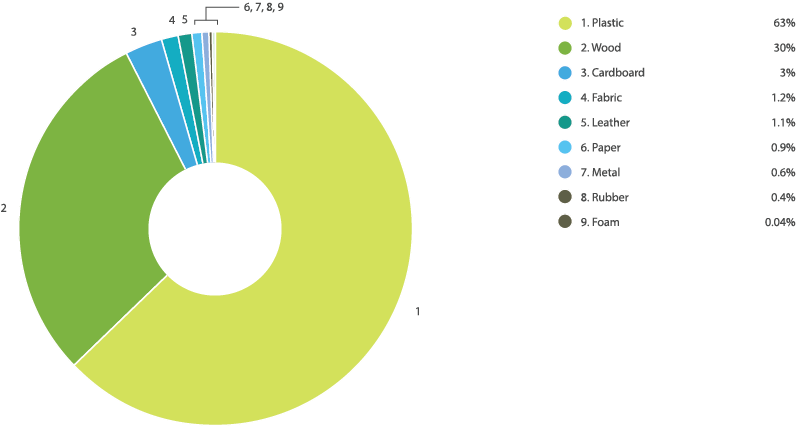
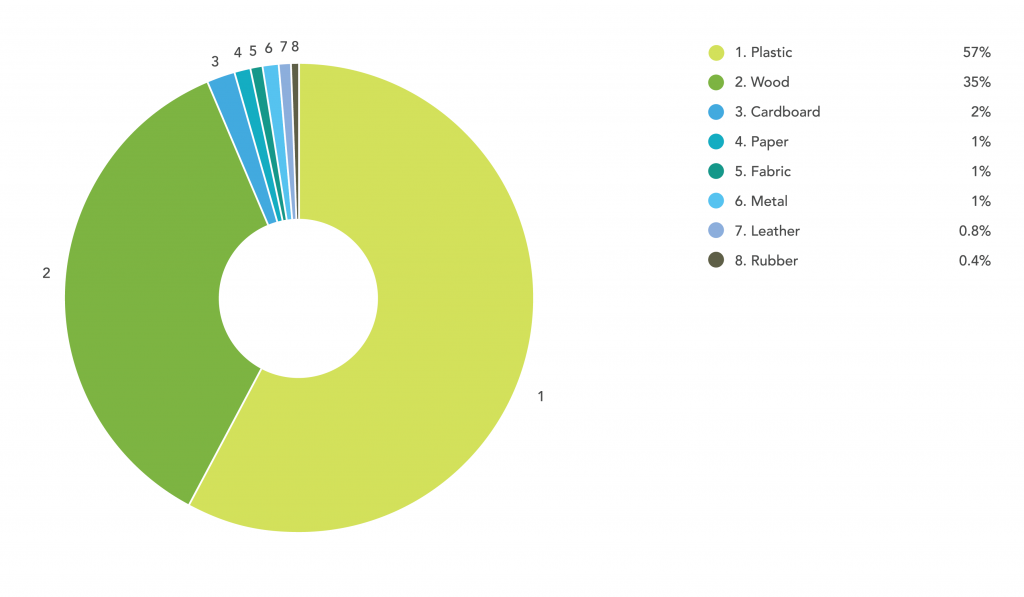
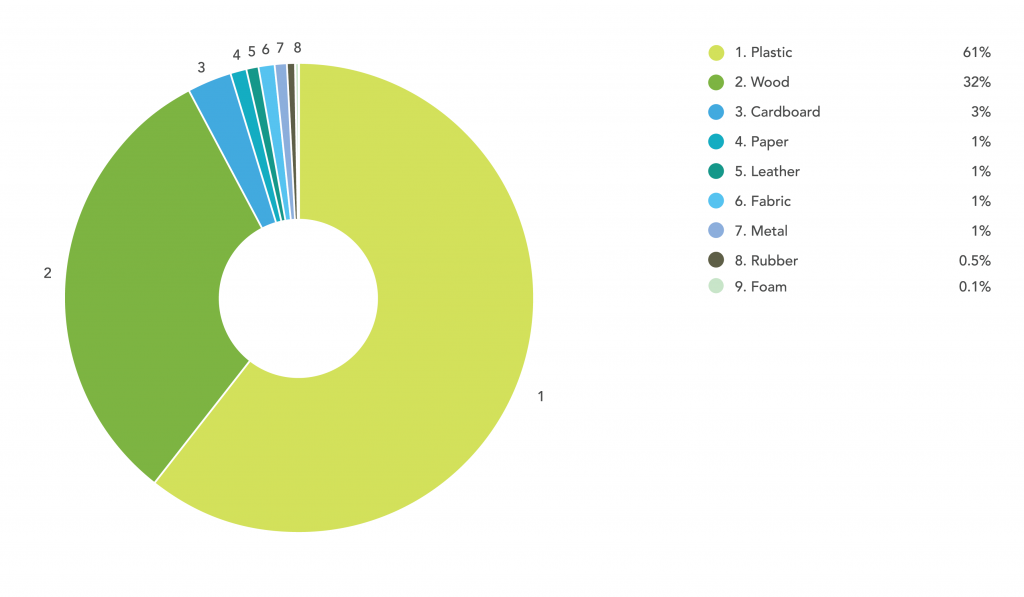
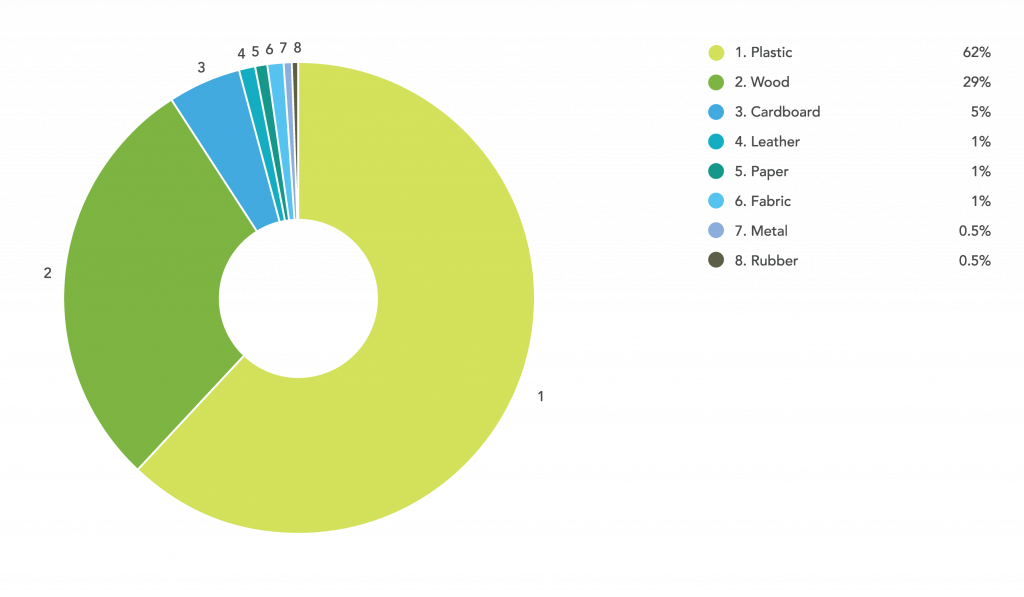
Most Used Categories
Plastic and Wood retain the top positions with Metal making a strong rise to place No. 3, increasing in use from 1.1% right up to 3%. The use of Cardboard and Paper were both up as well, but not as much as Metal. Foam drops down to just 0.1% use.
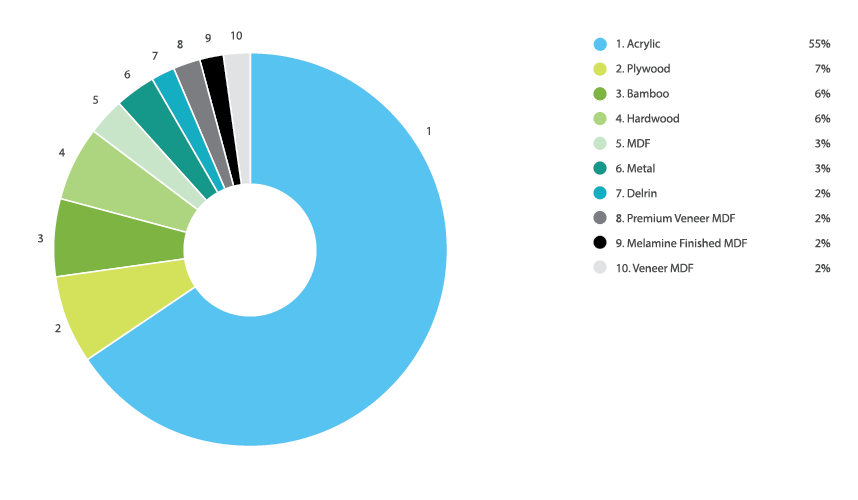
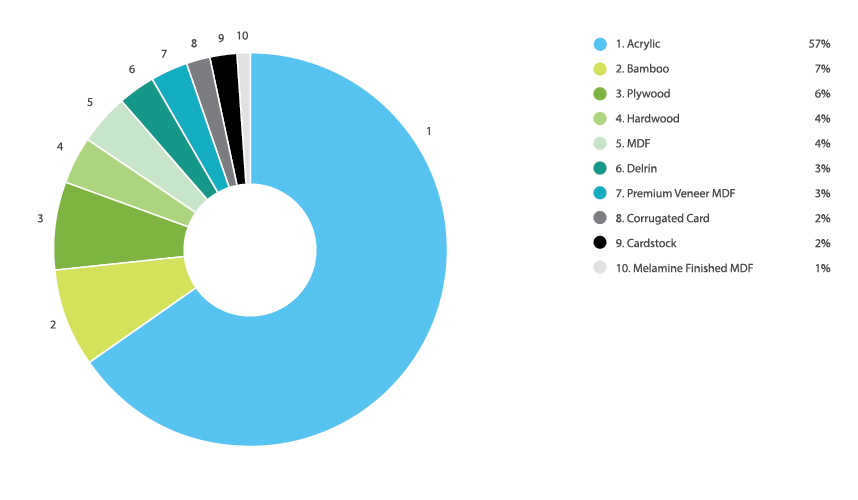
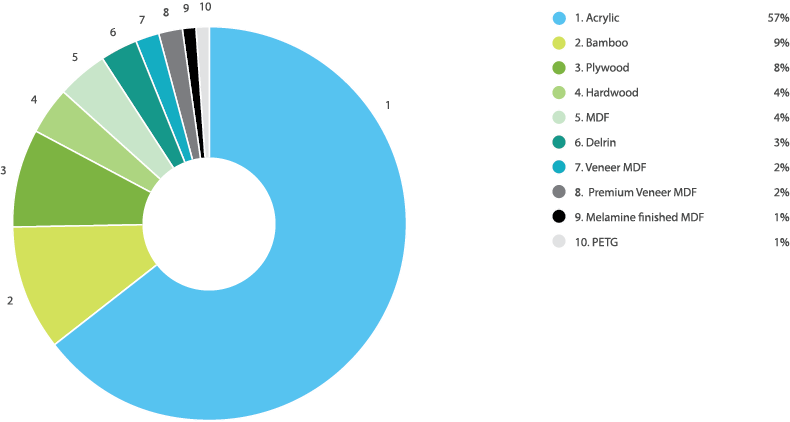
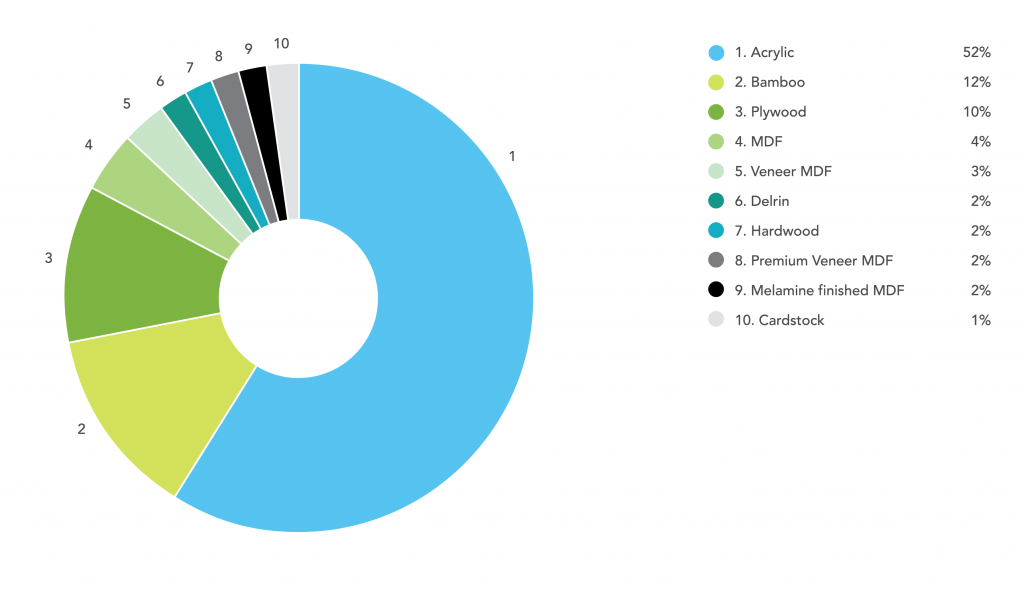
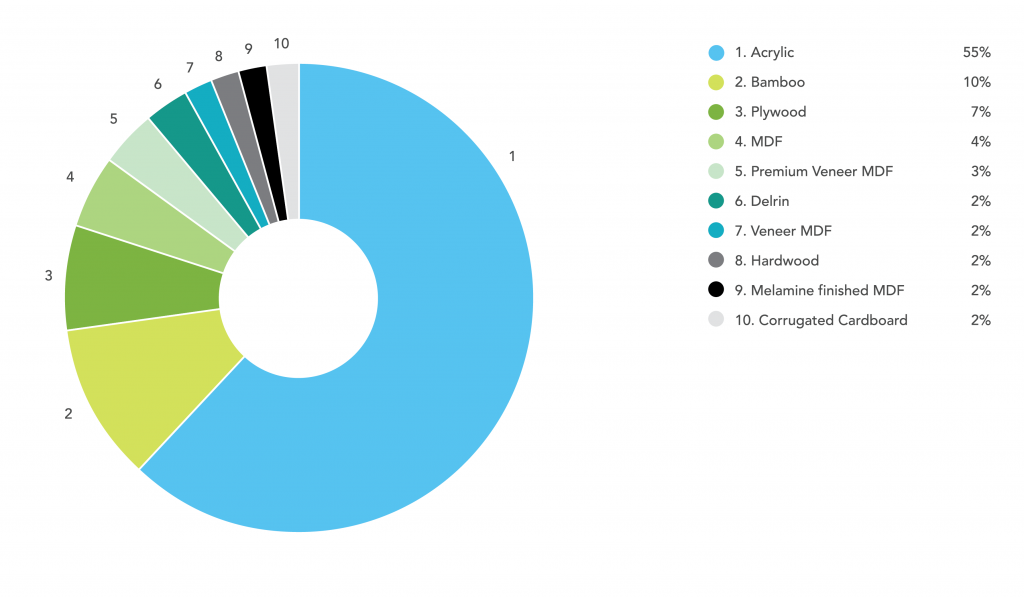
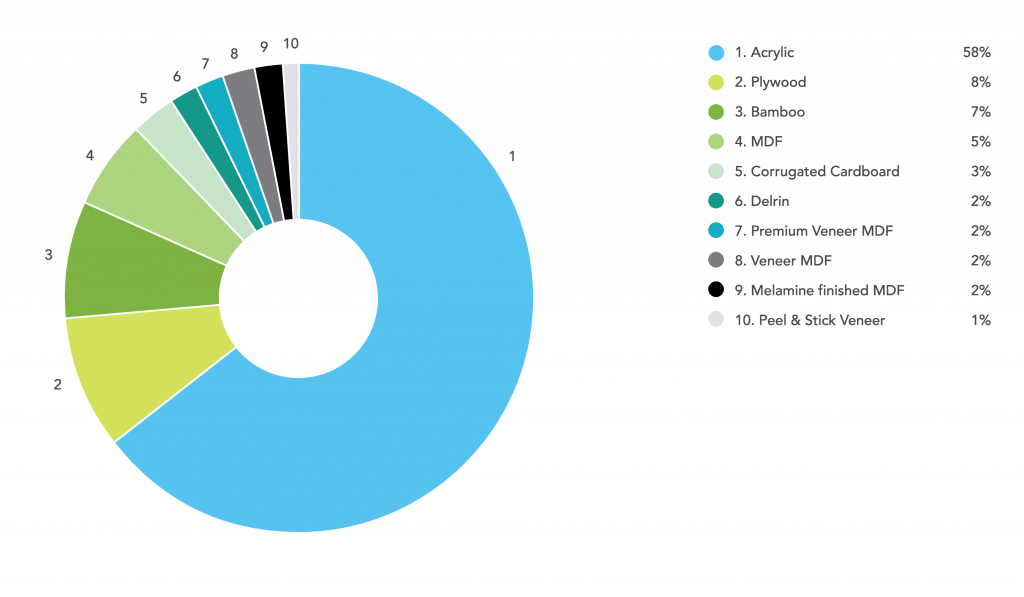
H4 Most Used Kinds
Metal jumps into the list at No. 6, bumping Corrugated Card out of the top 10. Cardstock also leaves the top 10 this quarter, making way for Veneer MDF.
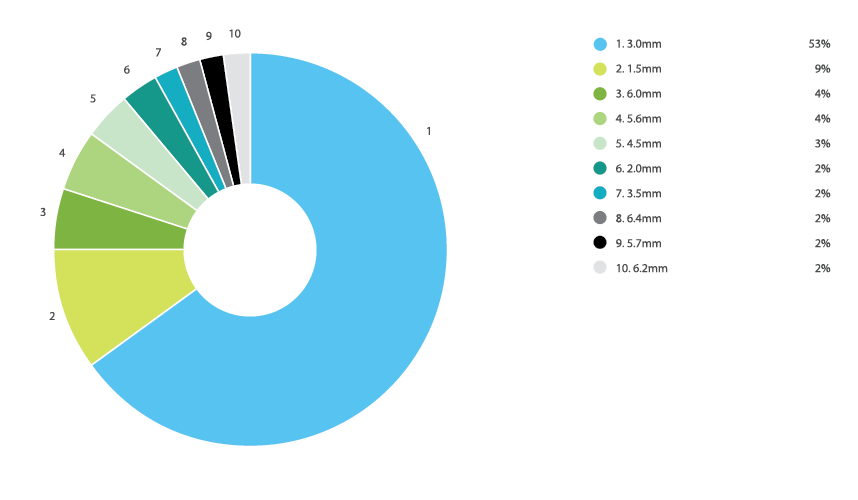
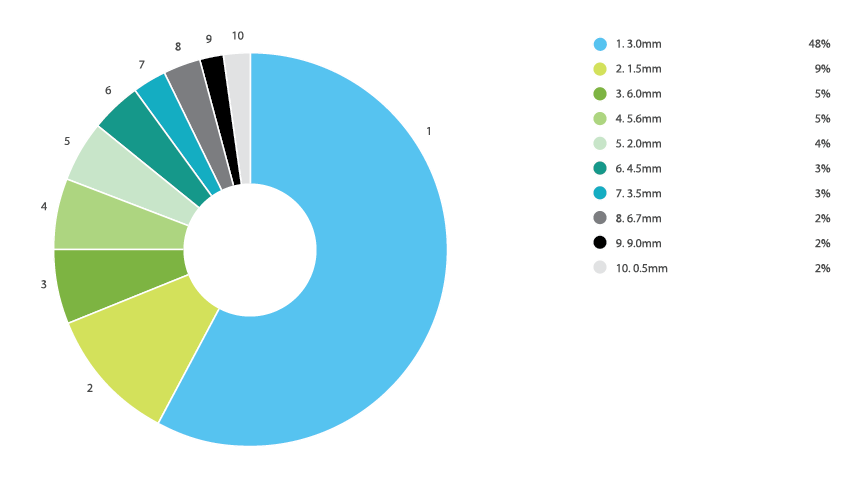
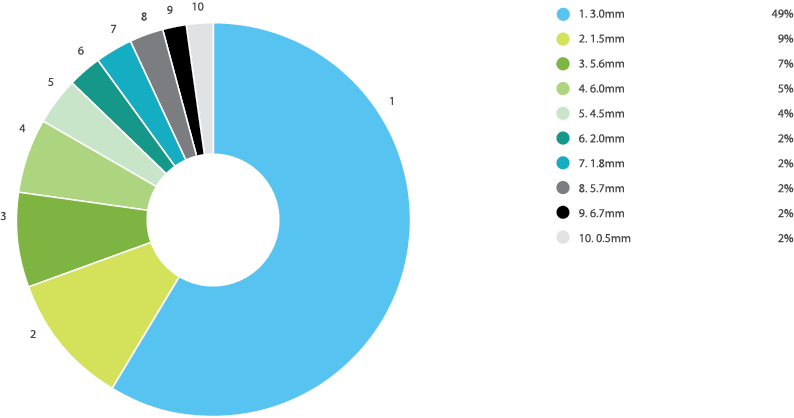
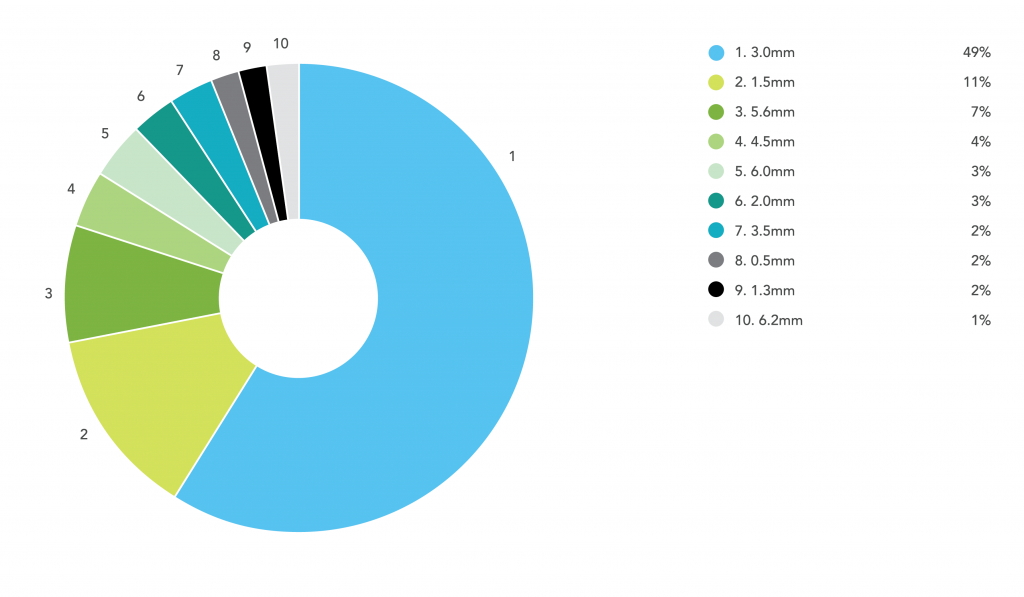
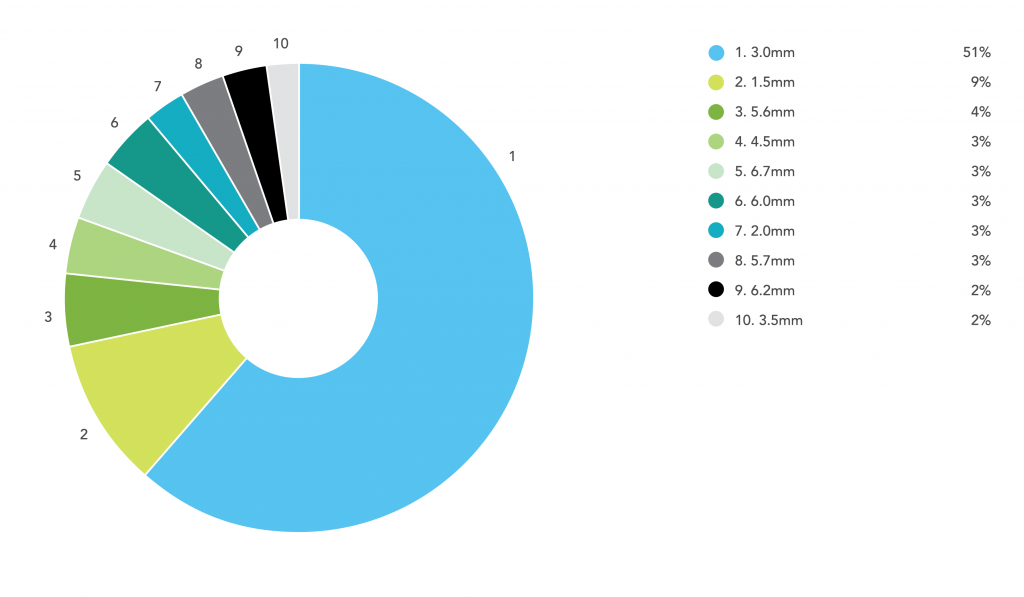
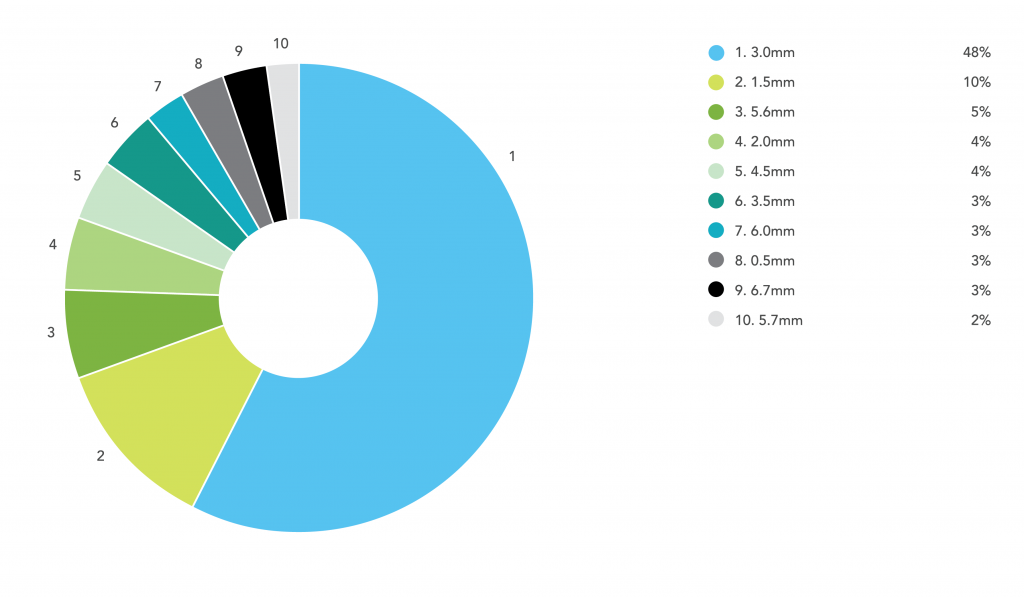
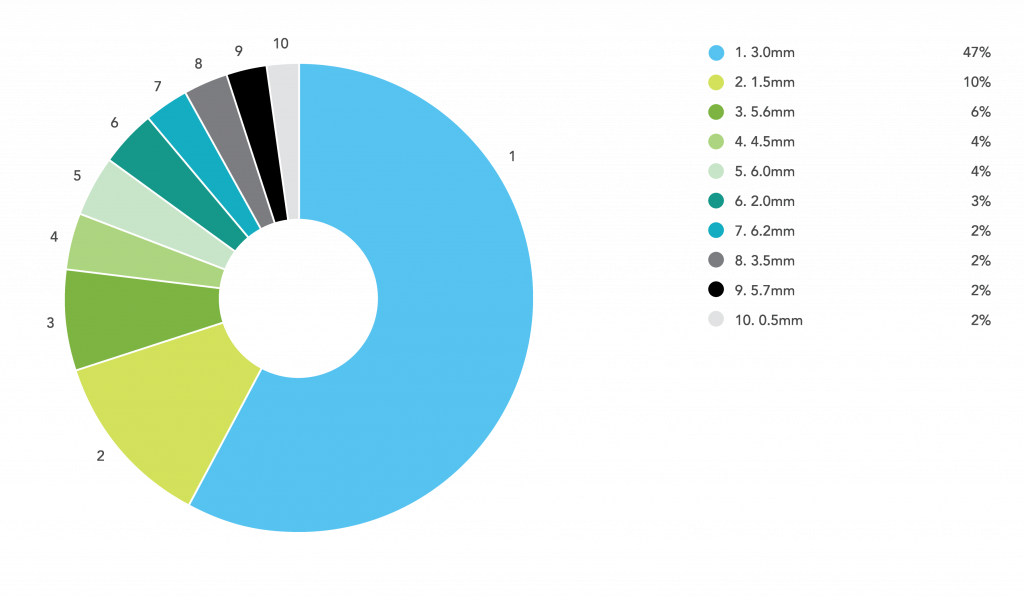
Most Used Sheet Thicknesses
Remaining in the top four are 3.0mm, 1.5mm, 6.0mm and 5.6mm. Next up are 4.5mm and 2.0mm which have swapped positions again. Additionally, 6.7mm, 9mm and 0.5mm are all kicked off the board in favor of 6.4mm, 5.7mm and 6.2mm, respectively.
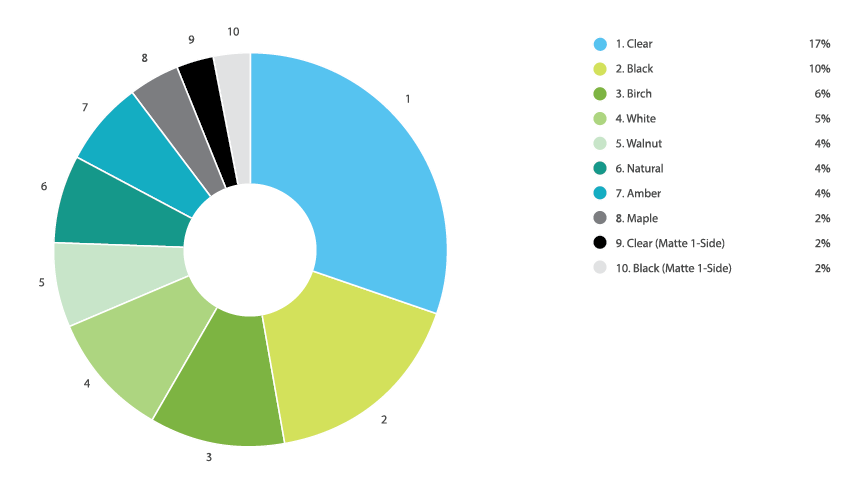
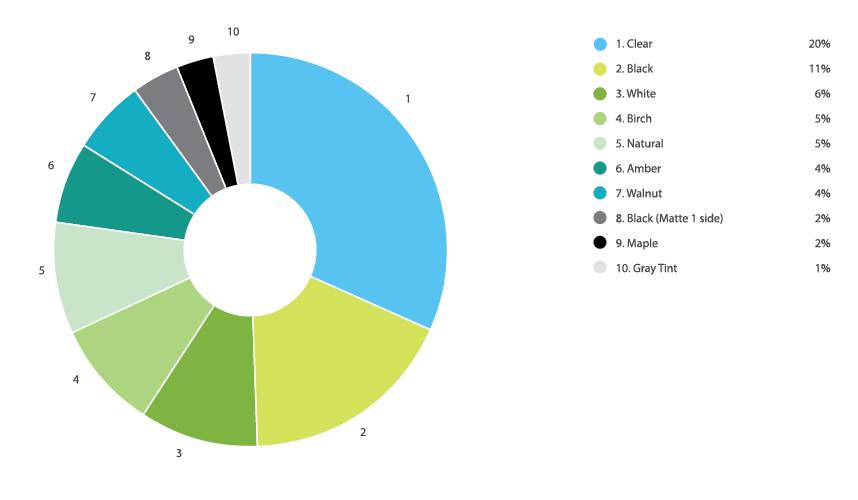
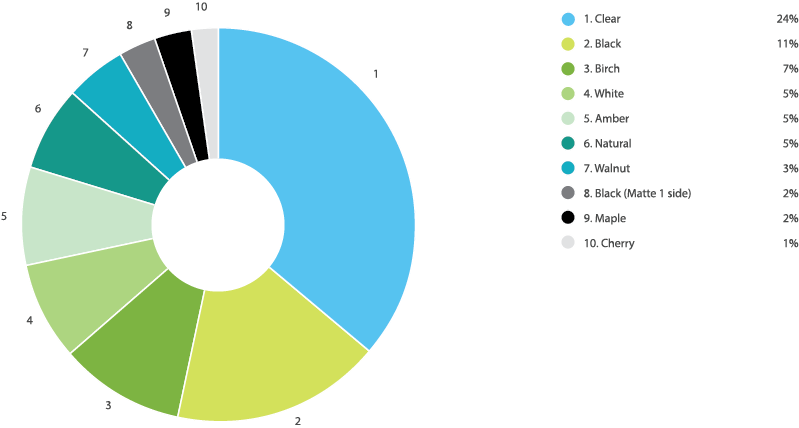
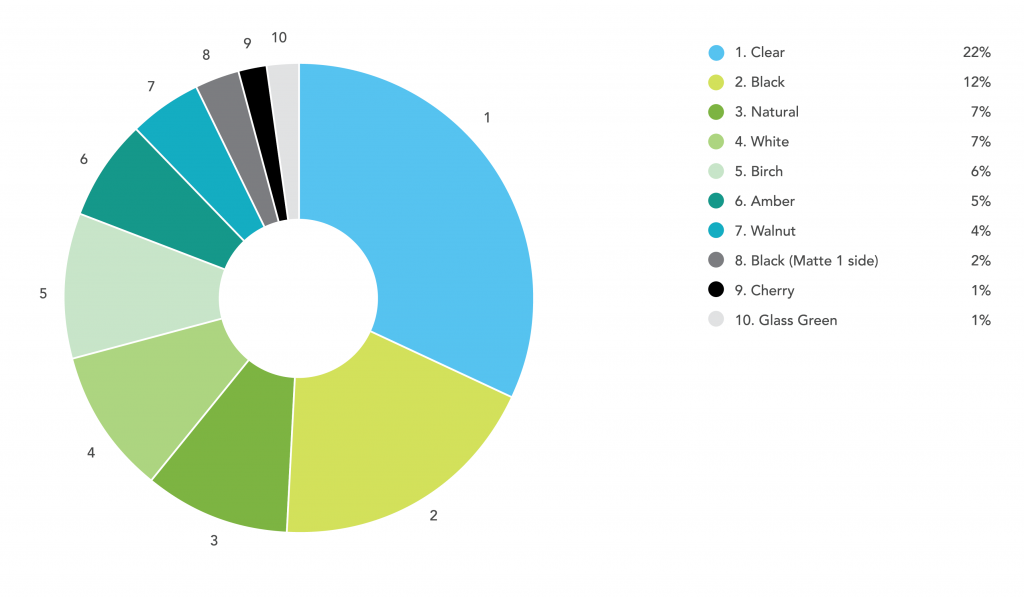
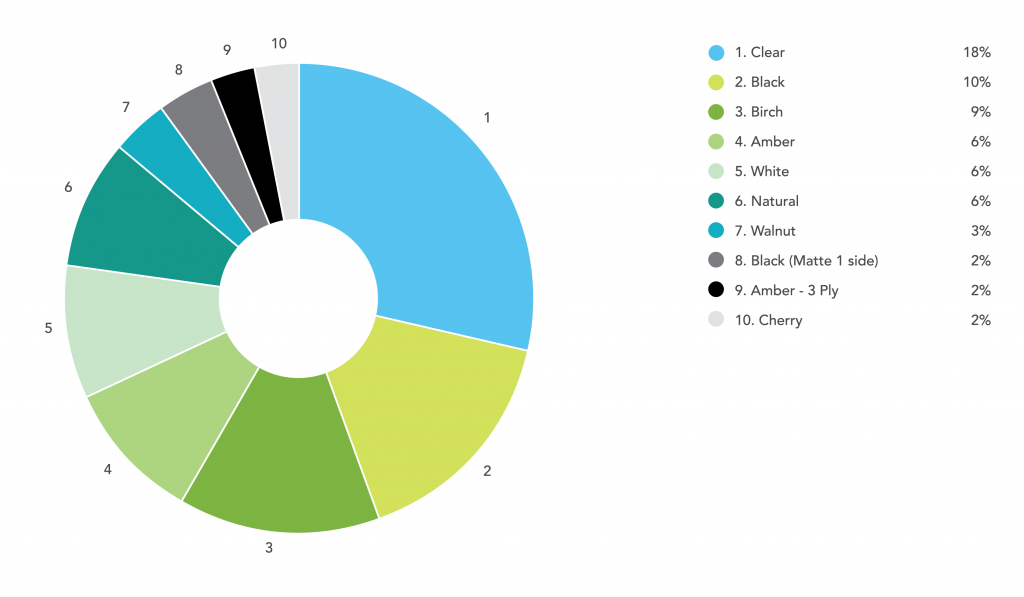
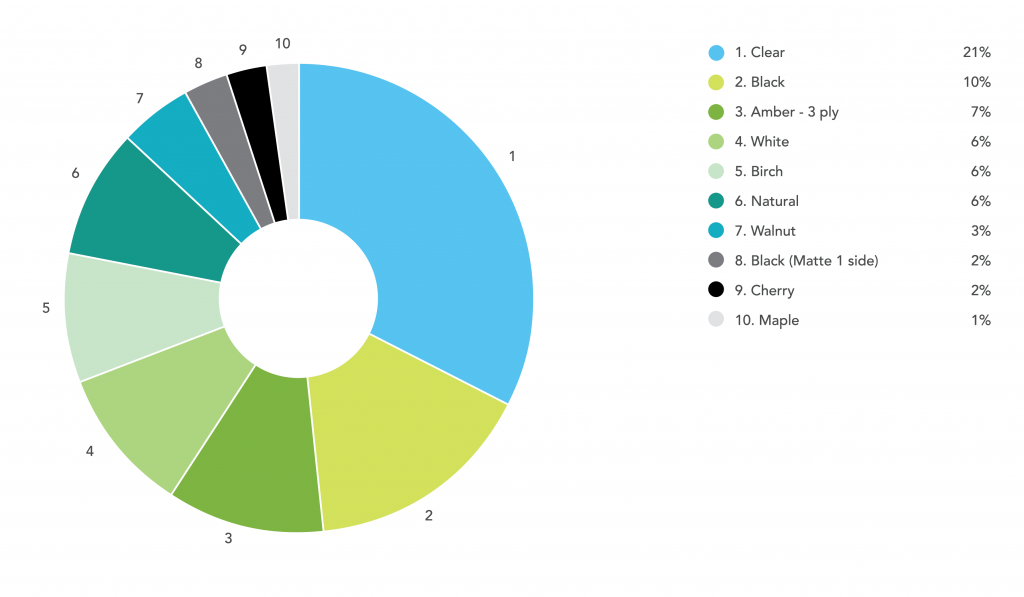
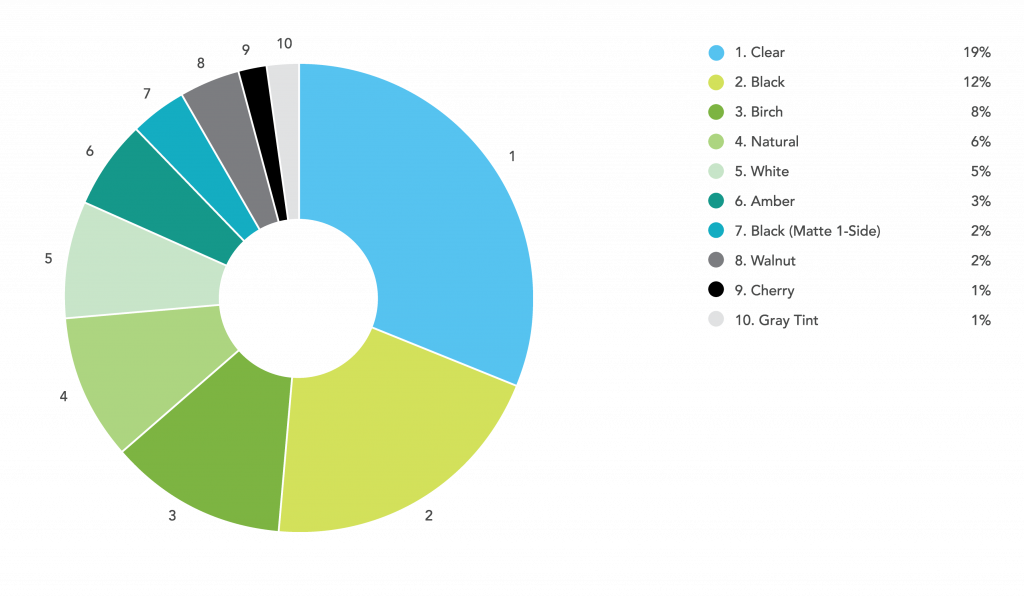
Most Used Colors
Per usual, Clear Acrylic is on top! Is it the great price, the range of thicknesses or the ability to make awesome edge lit electronics? You tell us. Birch Wood tops White Acrylic again, but that change may have something to do with Clear Matte Acrylic jumping onto the board at No. 10, kicking off Gray Tint Acrylic. Walnut, Natural Amber and Maple wood shades have a wee shuffle between themselves.
Software
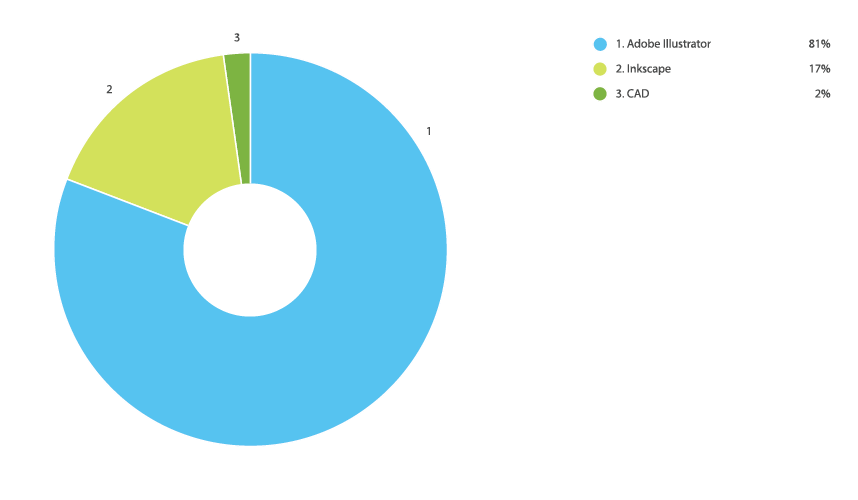
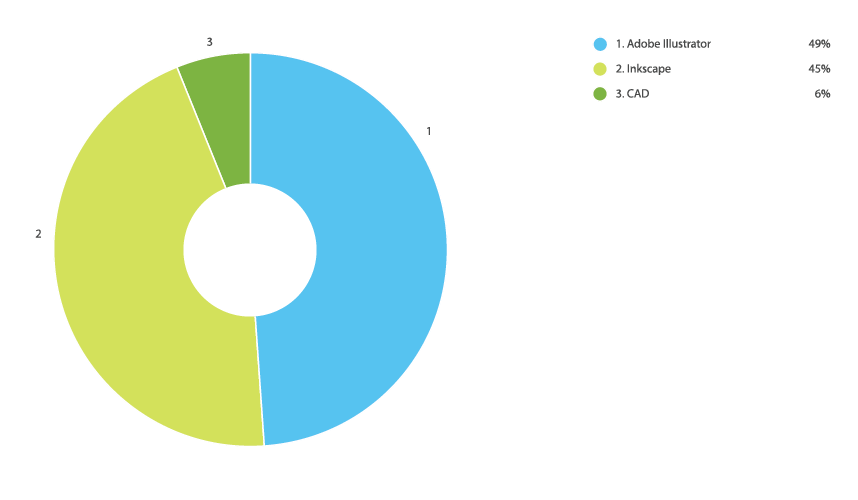
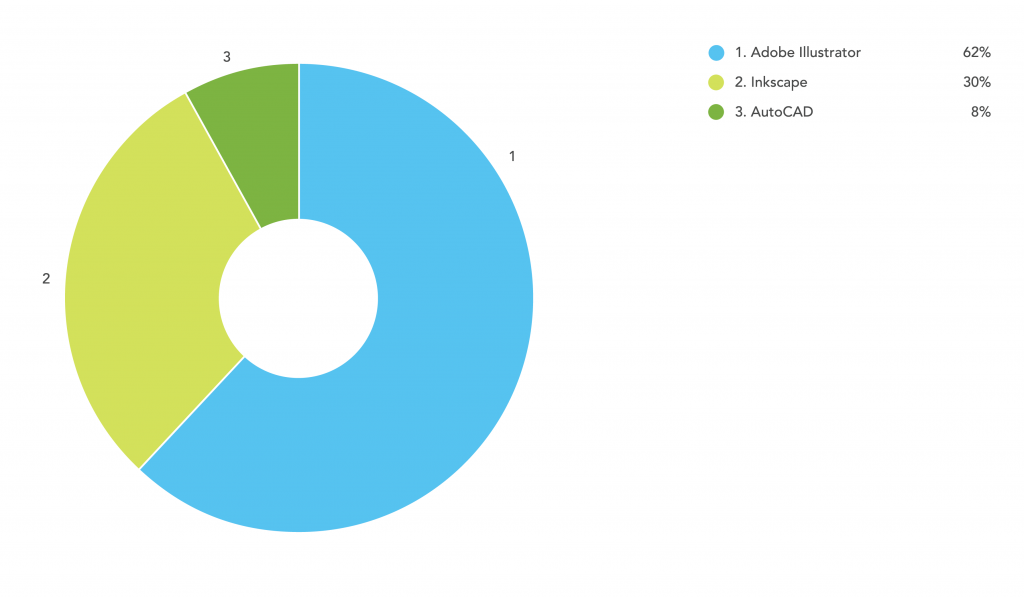
Most Used Design Software Tools
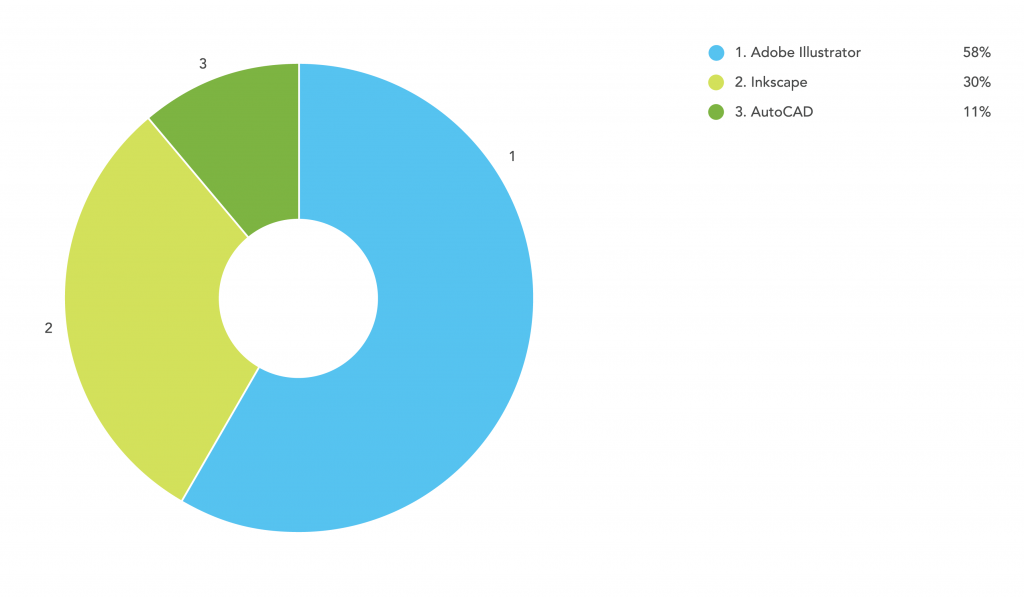
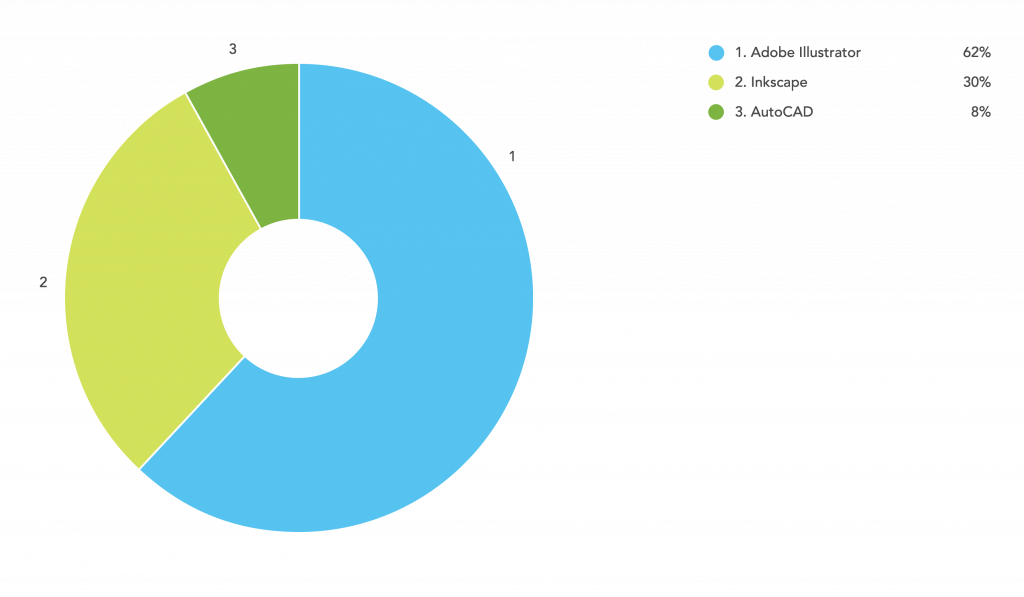
Big changes again in this category, as Adobe Illustrator regains the top spot with a monster lead. Inkscape drops down to 17%, and CAD also falls to 2%.
Quality
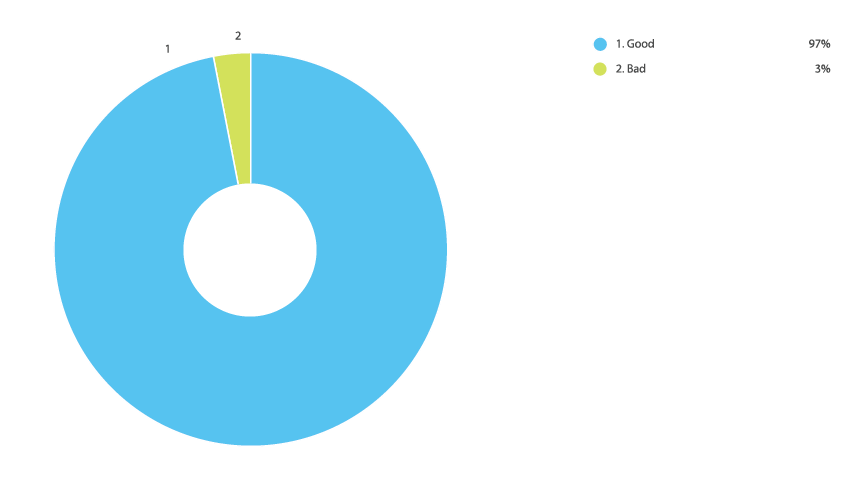
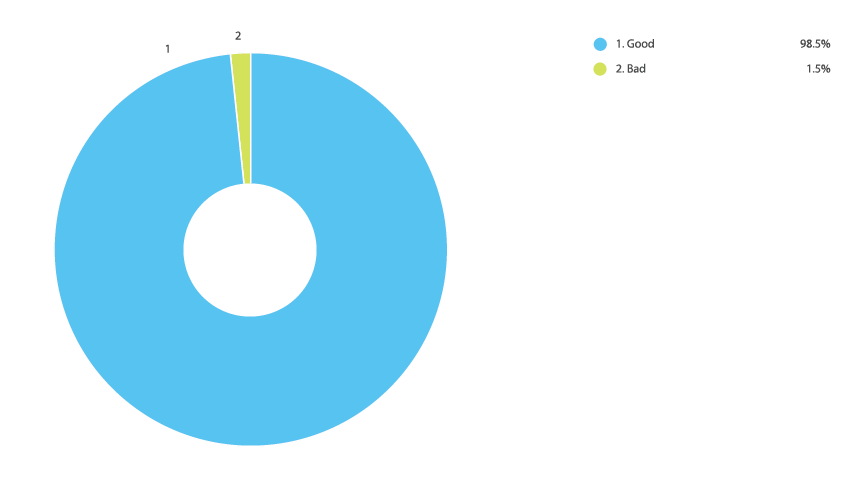
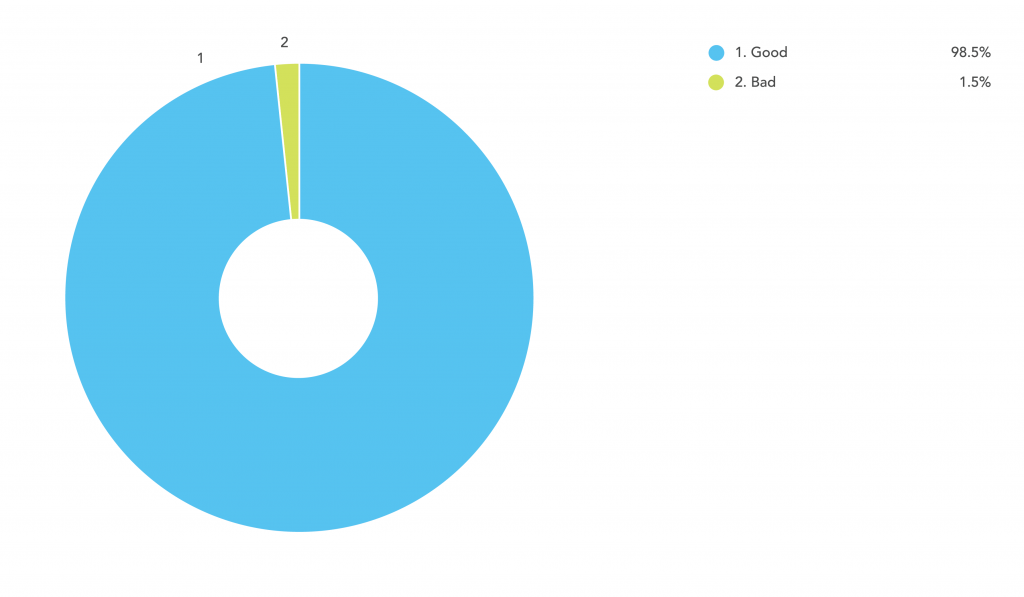
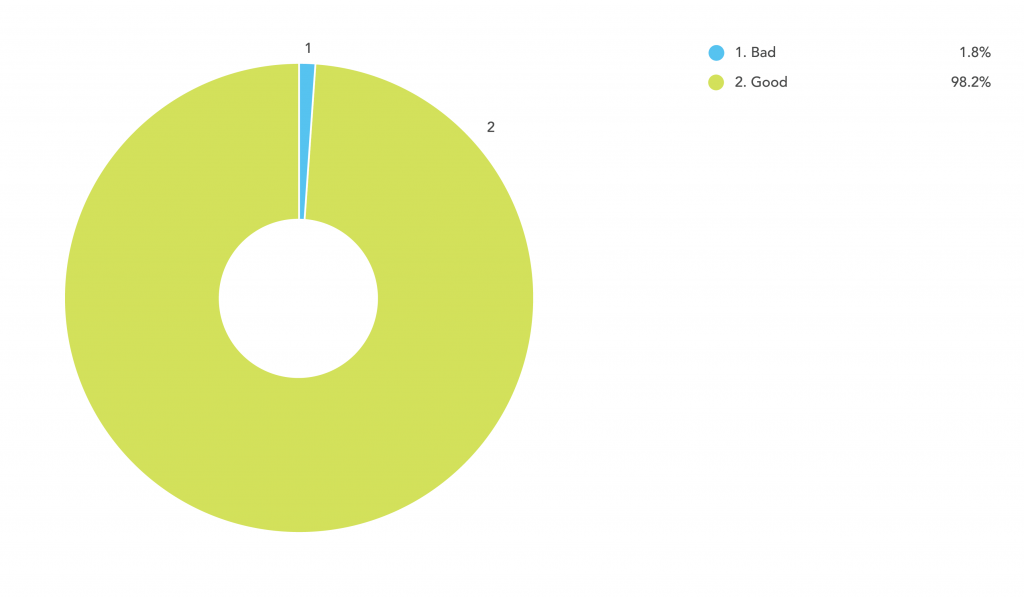
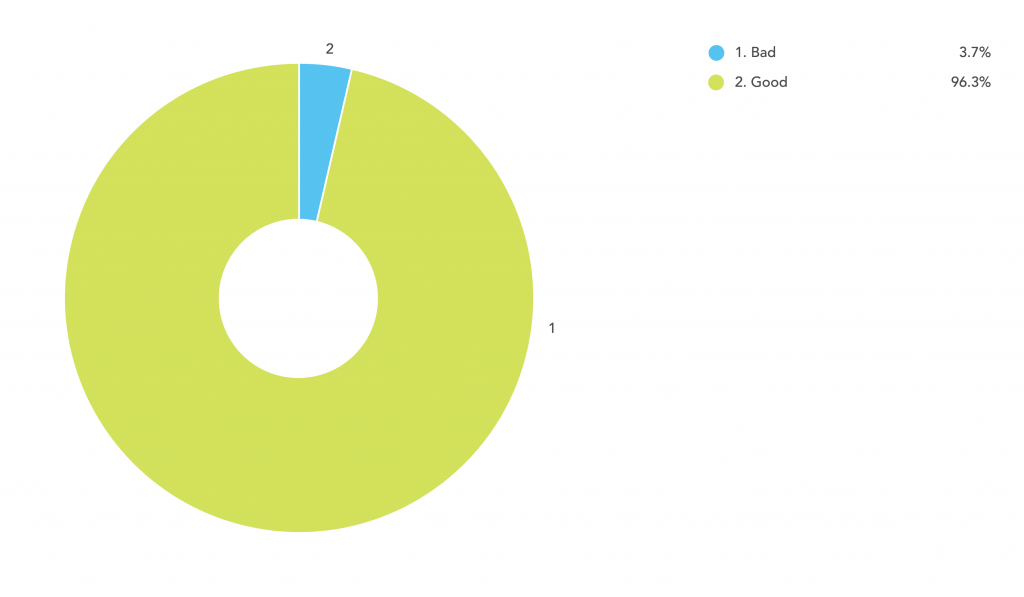
Percentage Delivered Good vs. Bad
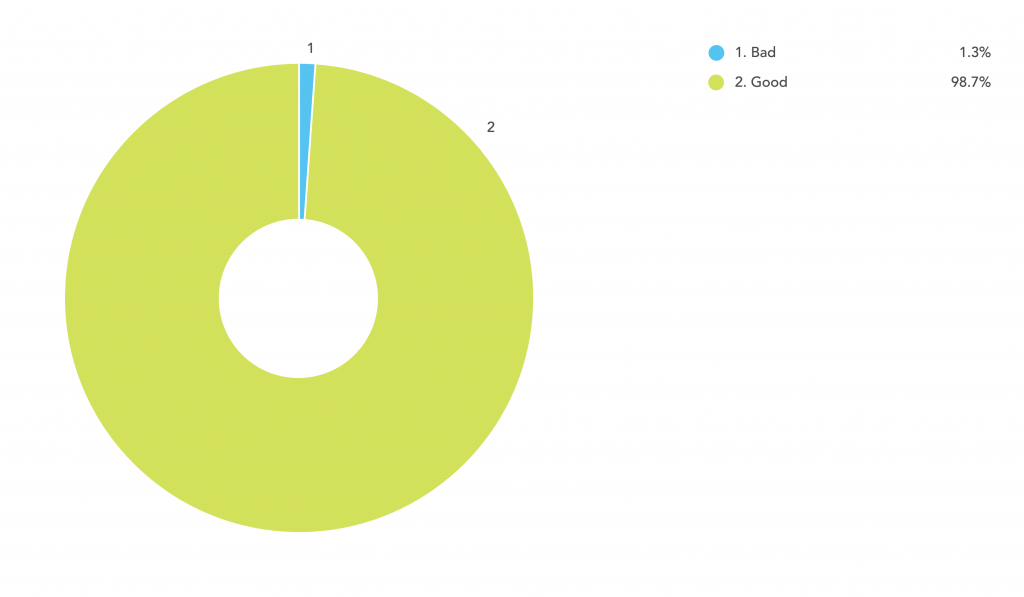
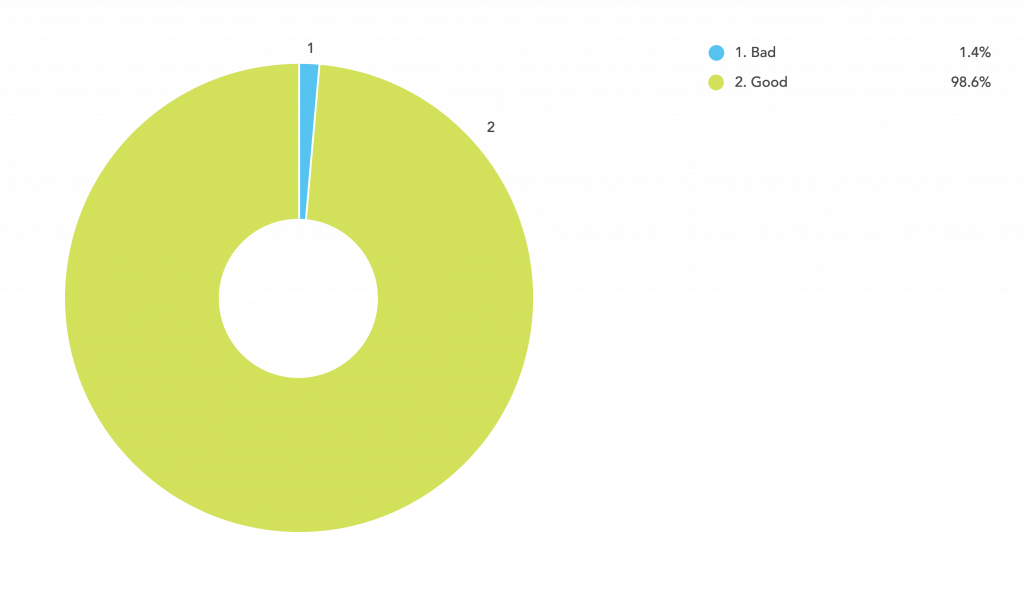
A slight decrease in quality from last quarter, down 1.5%. Bad orders are re-made and re-shipped for free, with no pesky returns necessary.
Speed
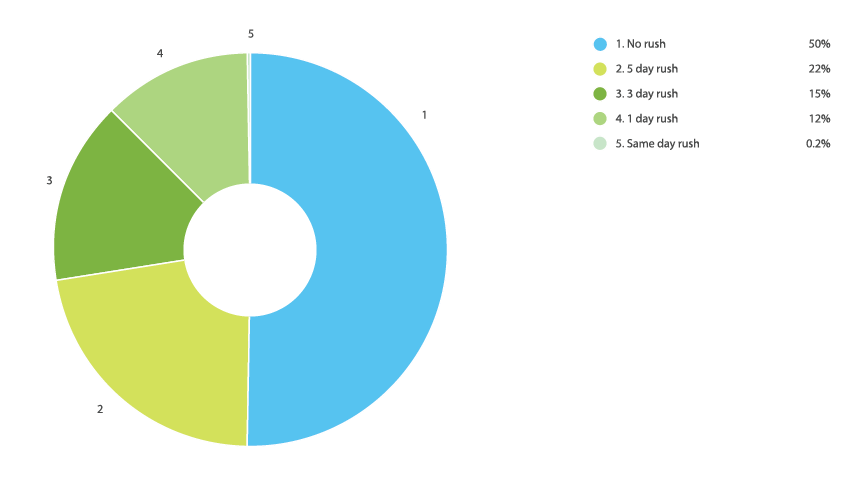
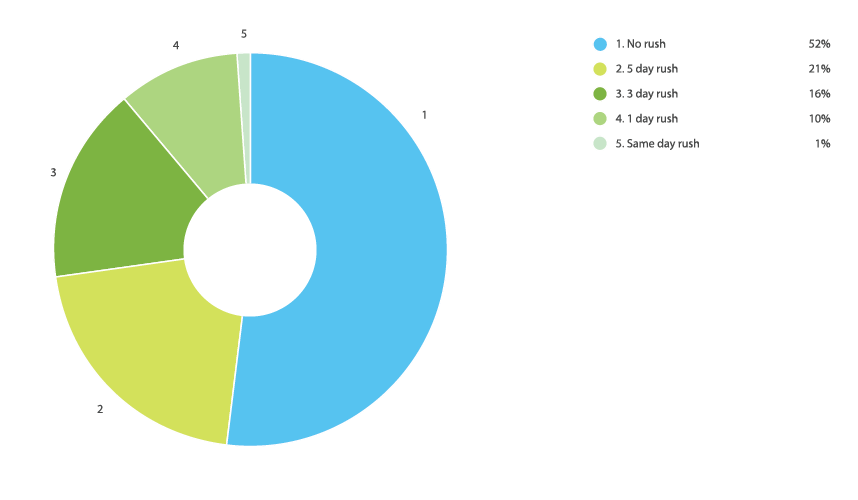
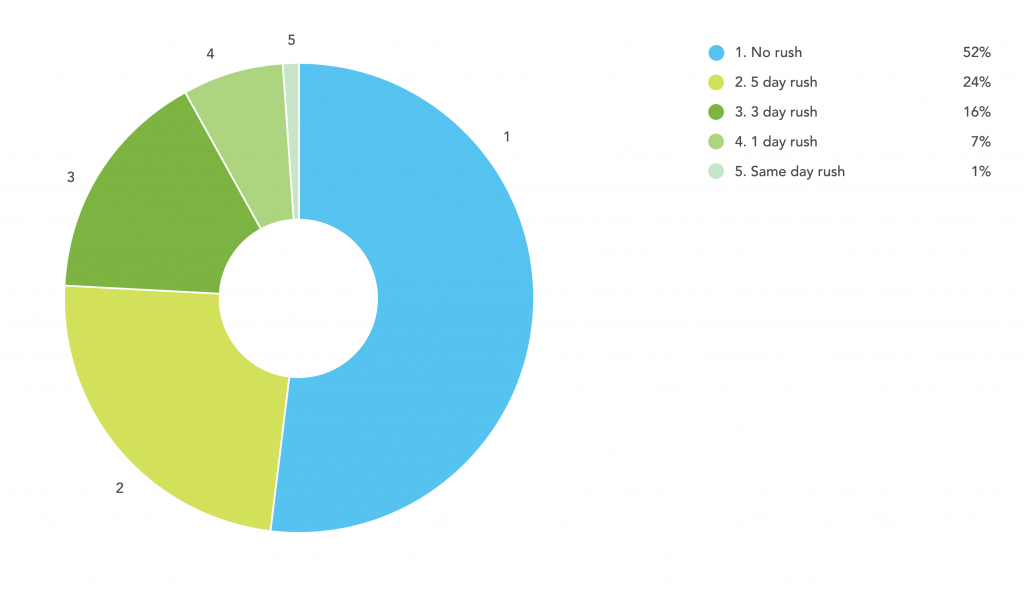
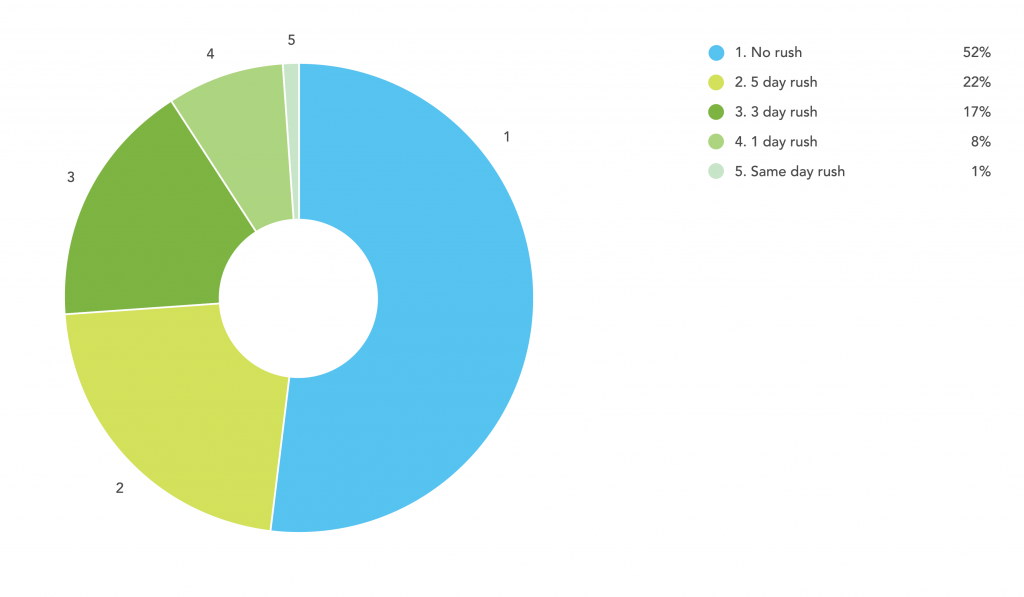
Most Used Making Speeds
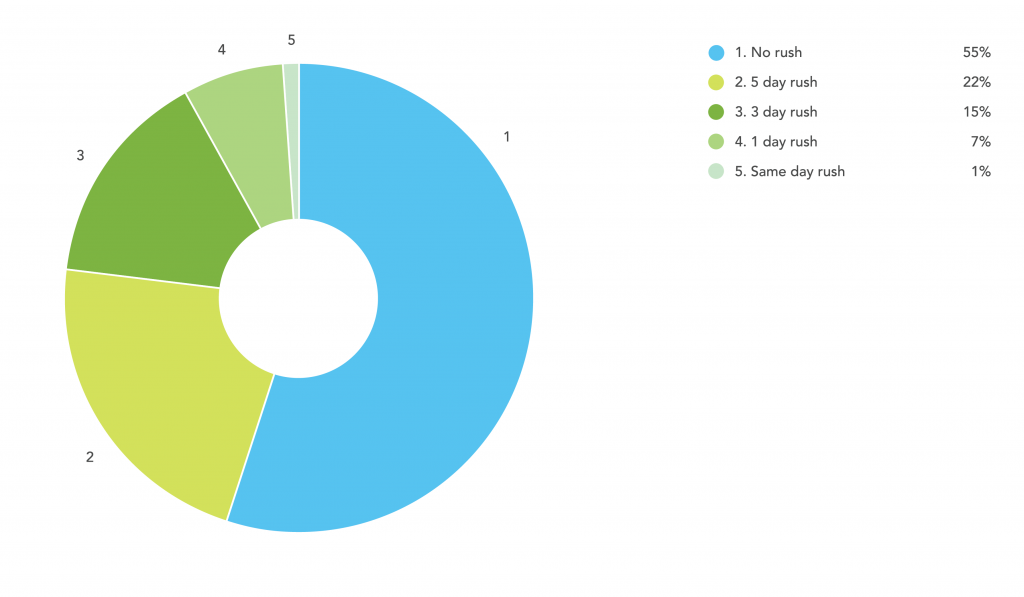
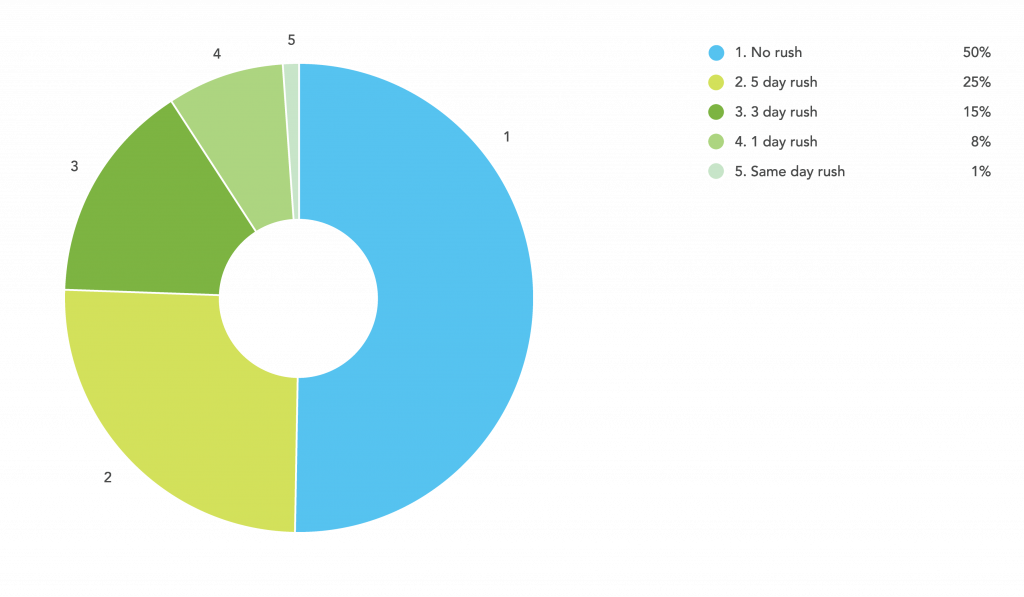
Five-day, one-day and same-day rush speeds are up this quarter, which is fairly normal with the holiday season creating urgency for many sellers.
Percentage Delivered On-Time vs. Late
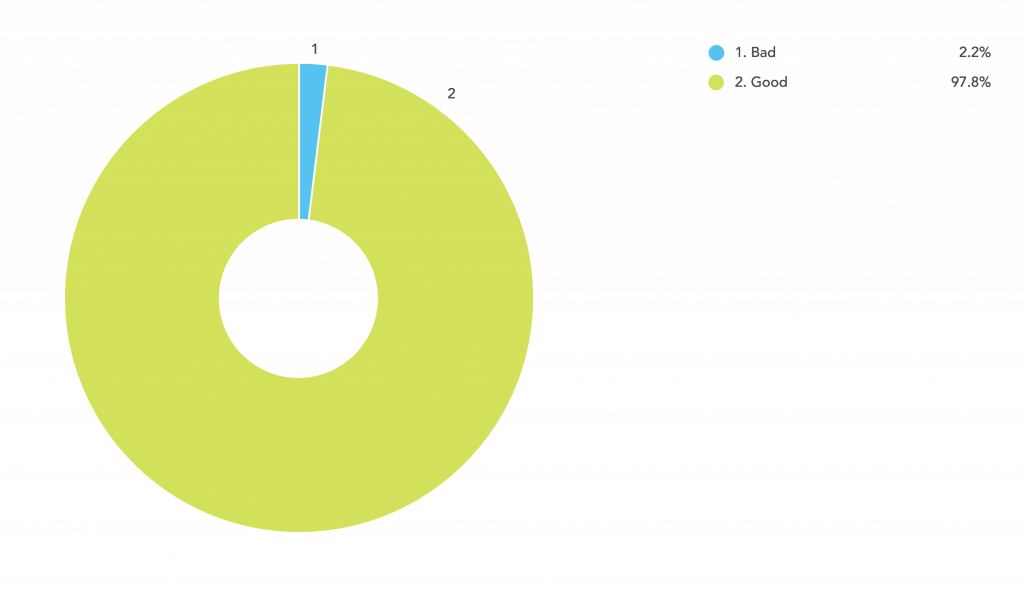
Late orders were up this quarter due to high demand before Christmas. This number reflects orders that weren’t shipped out on the assigned day, but many orders received upgraded shipping speeds to counteract the making delays here.
Geography
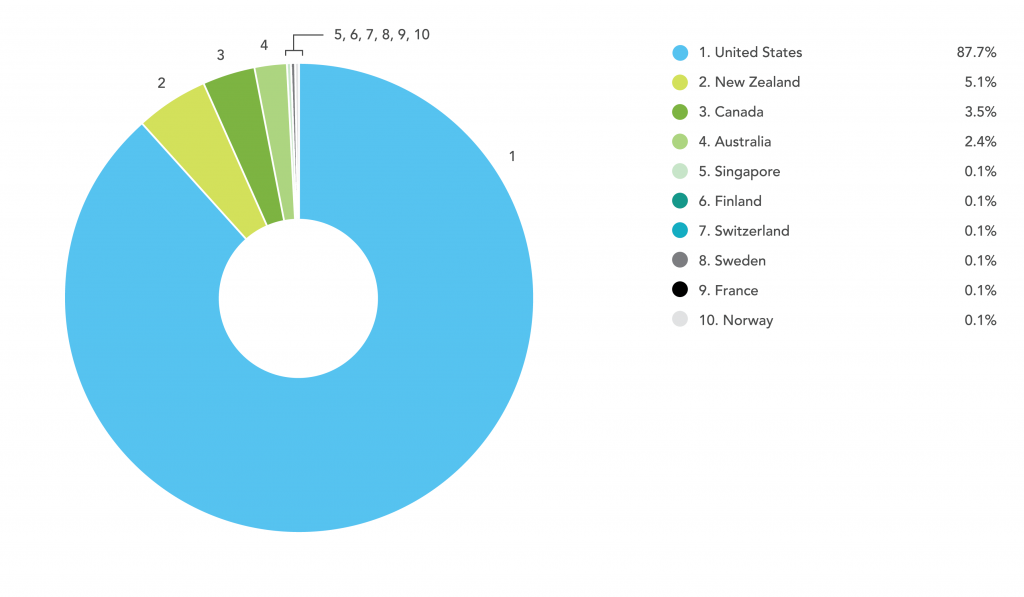
Top Laser Cutting Countries
The United States is still on top with 90% of orders. New Zealand remains second with Canada in No. 3. Japan leaves the top 10 with Singapore returning at No. 9.
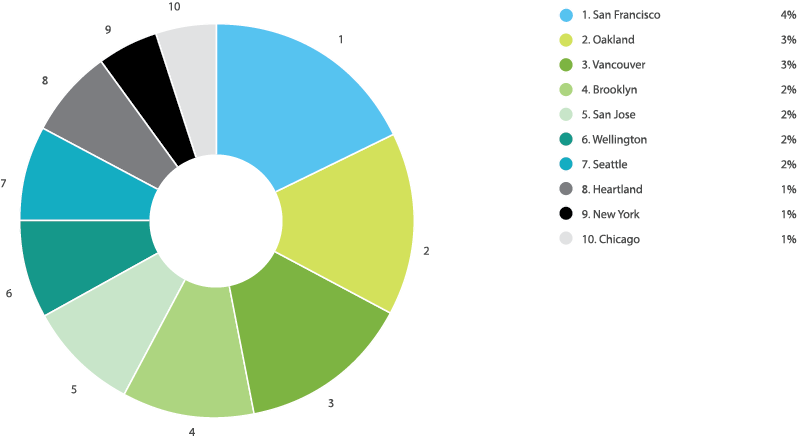
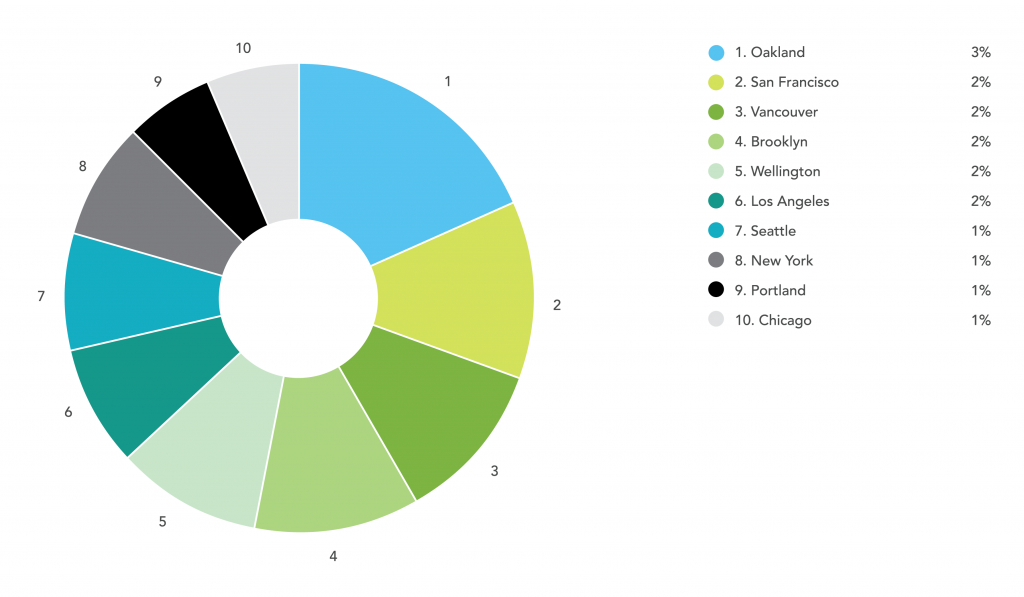
Top Laser Cutting Cities
Oakland is back on top with the most orders out of any city; being so close to the production room this makes perfect sense. San Francisco takes second place. Wellington drops down to place No. 6 with New York, Seattle and Los Angeles topping in at places three, four and five, respectively. San Diego leaves the top 10 with Sunnyvale jumping in at No. 8.
What’s Next?
This was our last report for 2019. You can view the previous quarters below. The most interesting change this quarter was the shuffling of cities as well as the mix of software used. As before, please let us know what other information you’d like included in future editions.
Online Laser Cutting Trend Report – Q3 2019
This quarterly report is for customers, suppliers and digital manufacturing industry trends analysts to learn more about online laser cutting.
It’s the only report of its kind, with real world data from Ponoko, an online laser cutting pioneer visited by 1,000,000 people per year.
This is our third report for 2019. Let’s see what’s changed:
Laser Technique
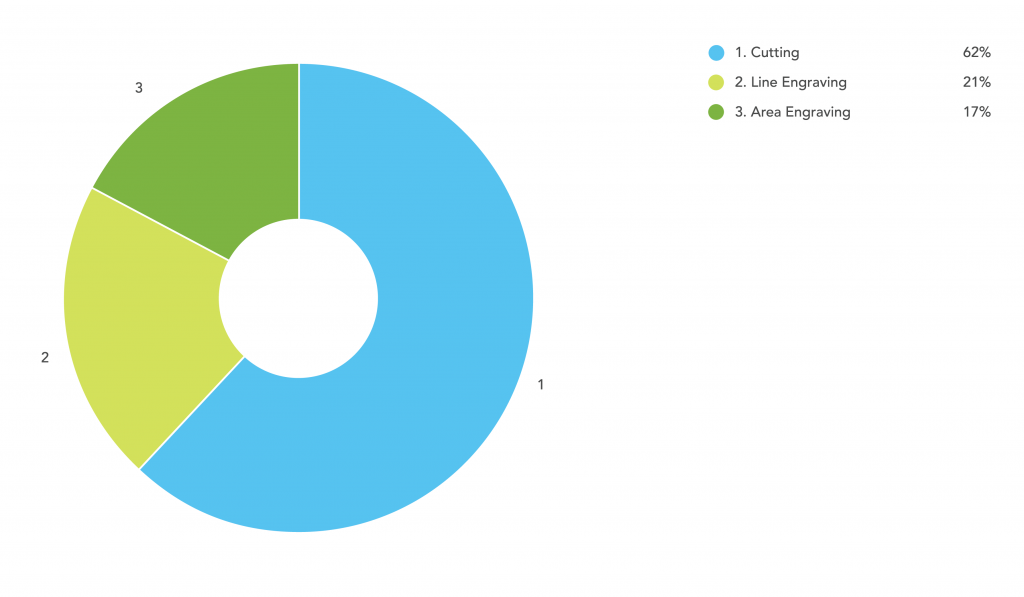
Most Used Laser Technique
Laser Techniques remain fairly steady with cutting in the lead. Line engraving has dropped a little with area engraving increasing slightly this quarter.
Materials
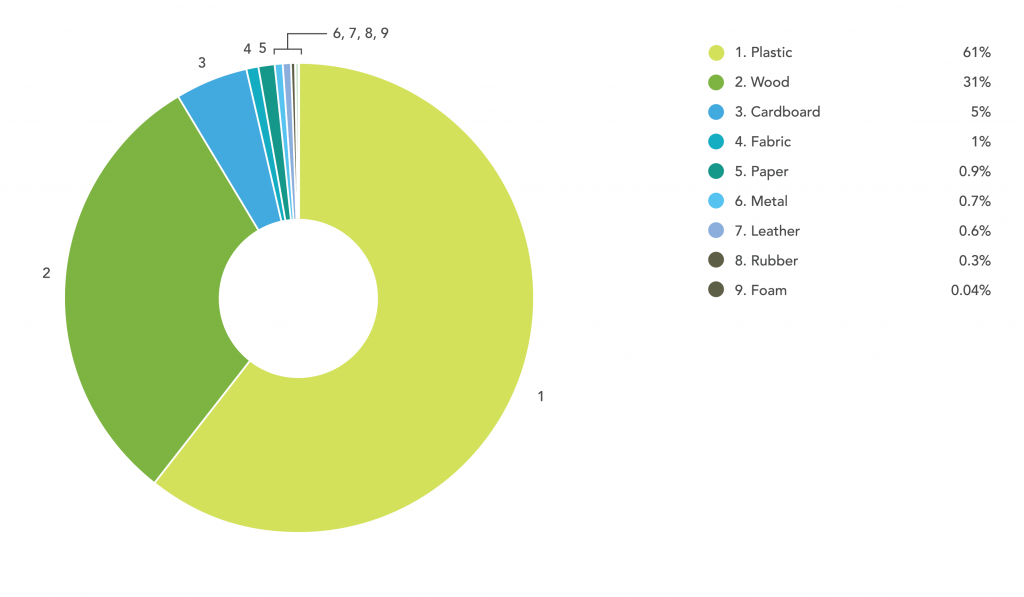
Most Used Categories
Paper and Metal move up the list to positions four and five, bumping Leather down the list. Plastic, Wood and Cardboard retain the top three positions, once again.
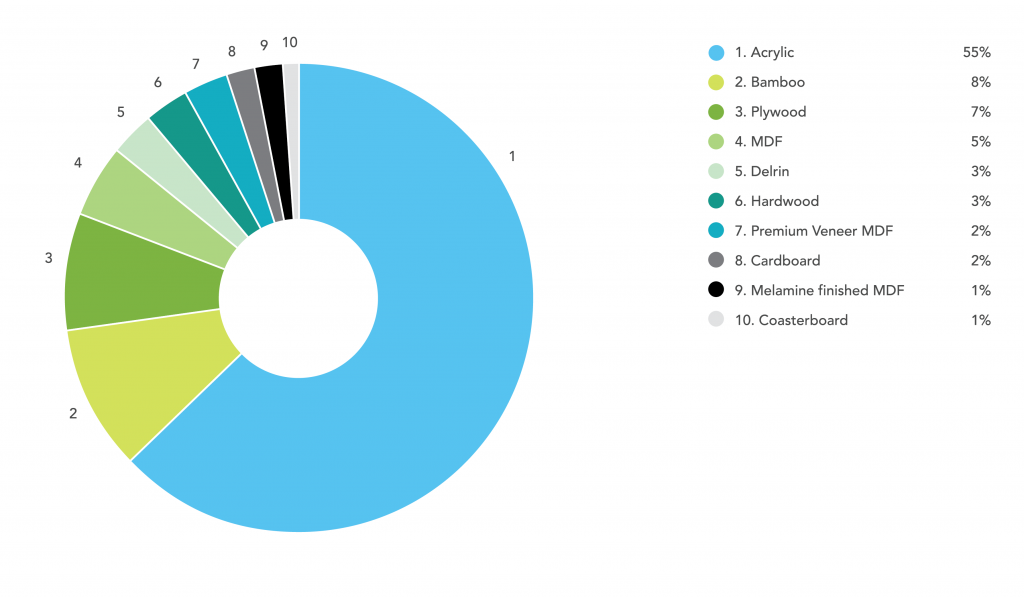
Most Used Kinds
Acrylic is most popular, as always, even increasing by 5% this quarter. Bamboo, Plywood and Hardwood also retain their positions in the top four. Corrugated Cardboard and Cardstock knock Veneer MDF and PETG out of the top 10 materials.
Most Used Sheet Thicknesses
Once again 3.0mm obliterates the competition with 48% of all orders. New to the list this quarter are 3.5mm at No. 7 and 9.0mm at No. 9. They push out 5.7mm and 1.8mm from the top 10. Additionally, 6.0mm and 5.6mm have switched places with one another as have 2.0mm and 4.5mm.
Most Used Colors
Clear retains the top spot, but softens by 4%. Black stays the exact same as last quarter with a popularity of 11%. White and Birch come next, but have switched places with one another since last quarter. Bamboo colors Amber and Natural follow closely after with Matte Black at No. 8 again. Gray Tint enters the top 10 with Cherry leaving the list.
Software
Most Used Design Software Tools
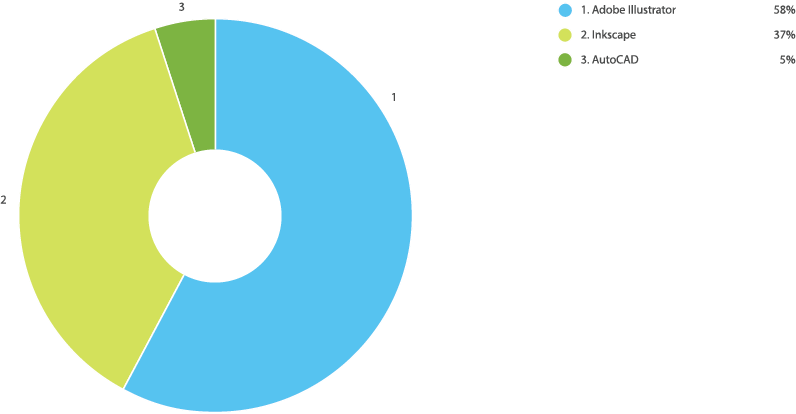
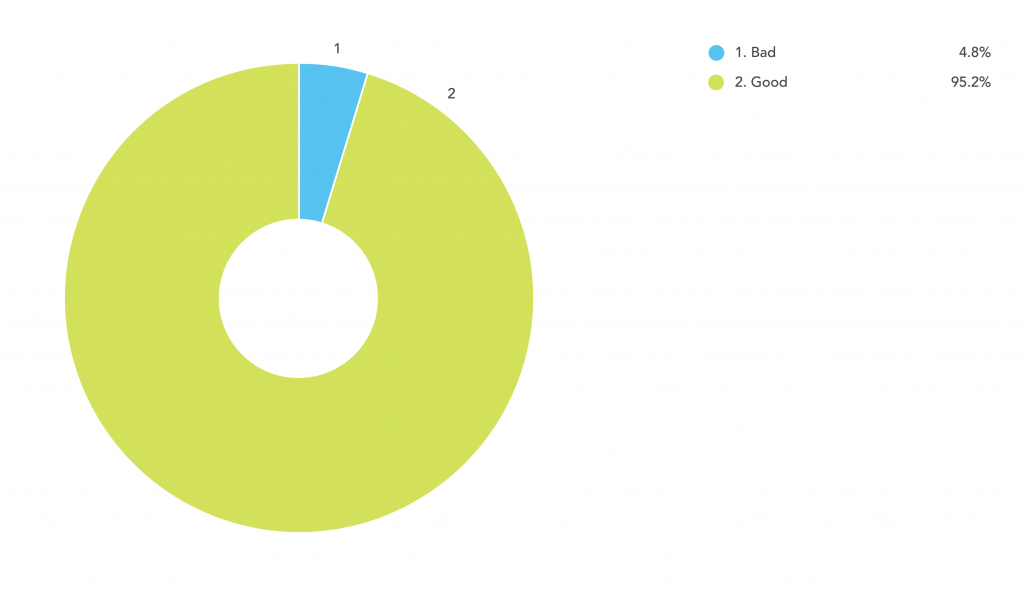
Adobe Illustrator and Inkscape are more closely matched, as Inkscape has grown in use from 37% last quarter to 45% this quarter while Illustrator drops from 58% to 49%. CAD is pretty much the same with only one percentage point difference.
Quality
Percentage Delivered Good vs. Bad
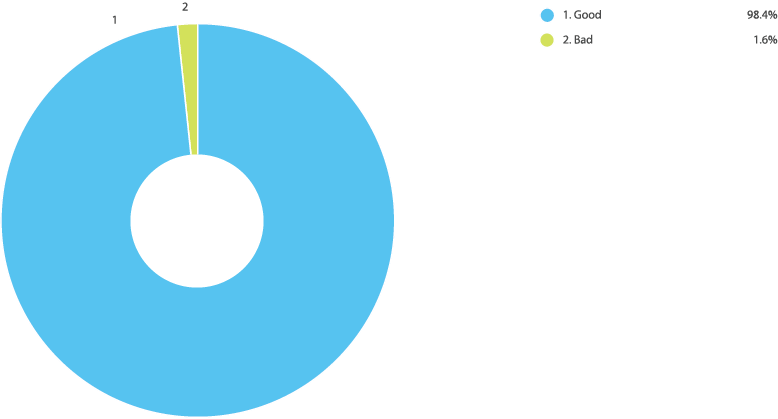
A slight increase in quality from last quarter. Bad orders are re-made and re-shipped for free, with no pesky returns necessary.
Speed
Most Used Making Speeds
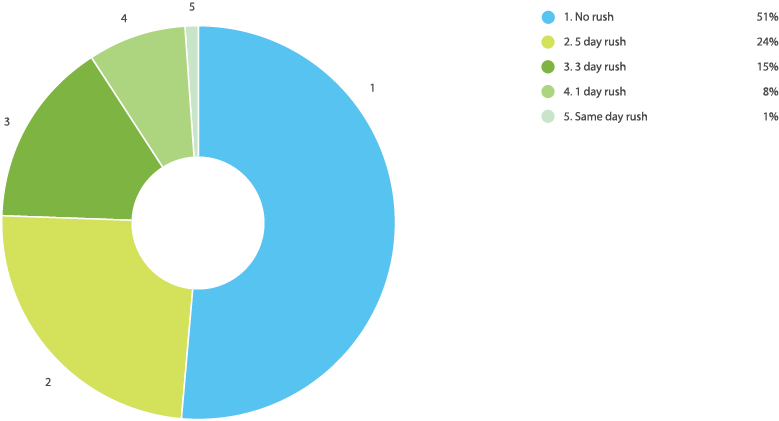
A slight increase in three-day and one-day rush orders with five-day rush dropping a little.
Percentage Delivered On-Time vs. Late
Late orders were up this quarter.
Geography
Top Laser Cutting Countries
The United States firmly holds the top spot with 88% of orders. New Zealand replaces Canada at No. 2. Japan is back on the board again this quarter, joined by newcomers Switzerland and Sweden. They replace Israel, Germany and Portugal at numbers eight, nine and 10, respectively.
Top Laser Cutting Cities
New York is officially in the top spot, followed closely by Oakland and San Francisco. Wellington rises to spot No. 4 while Vancouver leaves the top 10.
What’s Next?
This was our third report for 2019. You can view the previous quarters below. The biggest change we saw was New York jumping from No. 9 to first place. As before, please let us know what other information you’d like included in future editions.

Online Laser Cutting Trend Report – Q2 2019
This quarterly report is for customers, suppliers and digital manufacturing industry trends analysts to learn more about online laser cutting.
It’s the only report of its kind, with real world data from Ponoko, an online laser cutting pioneer visited by 1,000,000 people per year.
This is our second report for 2019. Let’s see what’s changed:
Laser Technique
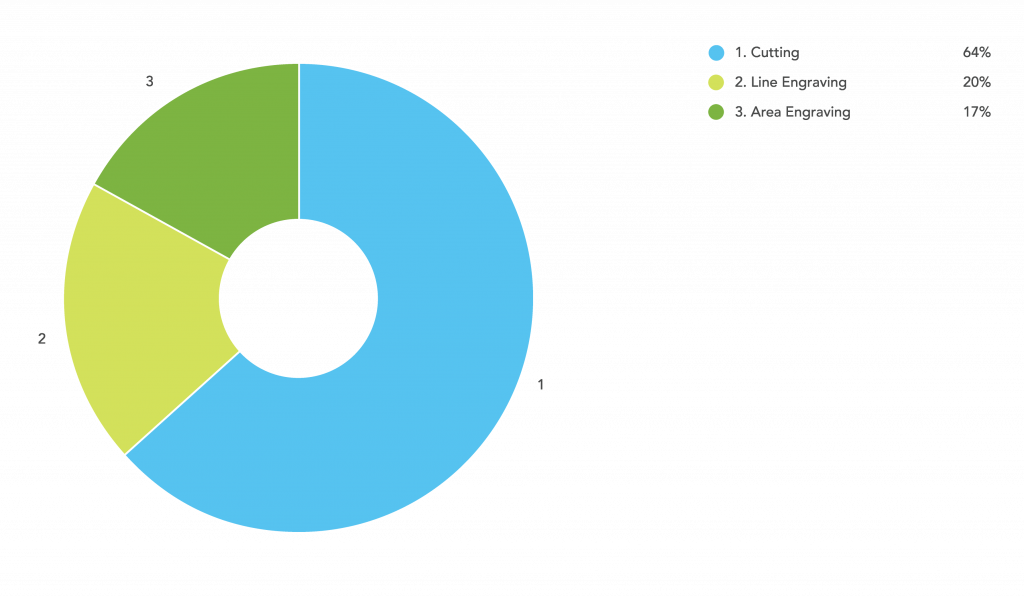
Most Used Laser Technique
No real changes in laser techniques from Q1 to Q2. Cutting is still the leader of the pack, with line engraving used just a tad more than area engraving.
Materials
Most Used Categories
The top four spots remain the same as last quarter, with Leather jumping from seventh to fifth place and Paper dropping from fifth to sixth. Metal drops one spot down to seventh, while Rubber and Foam remain at the bottom of the list.
Most Used Kinds
Acrylic, Bamboo and Plywood remain unchanged as the top three, with Hardboard jumping in popularity from sixth up to fourth place. Veneer MDF rejoins the board at seventh, PETG enters at tenth place and we say goodbye to Coasterboard being in the top 10 (for now).
Most Used Sheet Thicknesses
As usual, 3.0mm tops the board followed by 1.5mm and 5.6mm. Fourth and fifth places–4.5mm and 6.0mm–played switcheroo. Say goodbye to 3.5mm, 1.3mm and 6.2mm, which all left the top ten to make room for 1.8mm, 5.7mm and 6.7mm join at seventh, eight and ninth places, respectively.
Most Used Colors
Clear and Black retain their top spots at number one and two. Birch jumps from five to three and Amber moves up from six to five. Natural drops from three to six. Sad to see Glass Green leaving the top 10, but that makes room for Maple at number 9.
Software
Most Used Design Software Tools
The use of Inkscape is up by six percent with Illustrator and AutoCAD dropping. That said Illustrator still retains the top spot with more than double the amount of use.
Quality
Percentage Delivered Good vs Bad
A one-percent decrease in quality from last quarter. Bad orders were re-made and re-shipped for free, with no pesky returns necessary.
Speed
Most Used Making Speeds
A slight increase in one-day rush orders with three-day rush and no rush softening slightly.
Percentage Delivered On-Time vs Late
Late orders are down by quite a bit from last quarter; looks like the production team has been working hard to ship promptly.

Geography
Top Laser Cutting Countries
France replaces Japan at sixth place. Singapore and Malaysia leave the top 10, with Israel and Portugal replacing them at eight and 10th place.
Top Laser Cutting Cities
Vancouver drops down one spot to number three, San Francisco moves up to the top spot and Oakland down to second. San Jose jumps from number eight to number five and Wellington moves back up from number 10 to number five. New York drops from number five to number nine.
What’s Next?
This was our second report for 2019. You can view the previous quarters below. The best change we saw this quarter was the increase in delivery speed. As before, please let us know what other information you’d like included in future editions.

Online Laser Cutting Trend Report – Q1 2019
This quarterly report is for customers, suppliers and digital manufacturing industry trends analysts to learn more about online laser cutting.
It’s the only report of its kind, with real world data from Ponoko, an online laser cutting pioneer visited by 1,000,000 people per year.
This is our first report for 2019, but our fifth report overall. Let’s see what’s changed:
Laser Technique
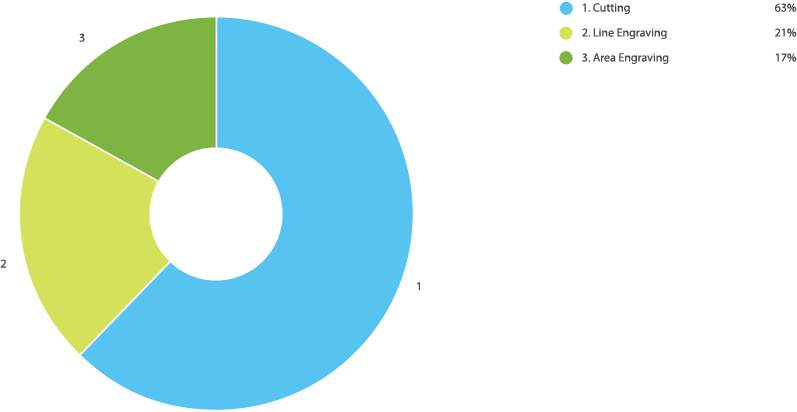
Most Used Laser Technique
Cutting is picking up with area engraving dropping down from last quarter.
Materials
Most Used Categories
Foam is back in the mix at the end of the list. Plastic is still up at number one, maintaining a strong lead over the other materials. This makes sense with the amount of plastics that cut and engrave well. Cardboard has pinched a bit of woods popularity, but wood is still a strong second to plastic.
Most Used Kinds
Coaserboard replaces cardstock at the bottom of the list this quarter, and we say goodbye to standard veneer mdf (premium veneer moves up to number seven, though). Cardboard comes in at eighth place, and acrylic strengthens its hold in the number one spot. Bamboo stays in second but softens a little with the other woods picking up some of the slack.
Most Used Sheet Thicknesses
Will 3.0mm ever be beaten for the top spot? Probably not; it’s one of the more common material thicknesses that exists for laser cut materials. The top four here seem to be consistently popular. A new one for eighth place is 0.5mm, and 1.3mm has also jumped on the board at ninth with 6.7mm and 5.7mm leaving the top ten.
Most Used Colors
Clear, Black, Natural and White beef up their numbers at the top spots with Birch and Amber softening a little. Glass Green joins the top 10 with Amber 3-Ply dropping off.
Software
Most Used Design Software Tools
The use of Adobe Illustrator is exactly the same as last quarter, with CAD usage slightly down and Inkscape usage slightly up.

Quality
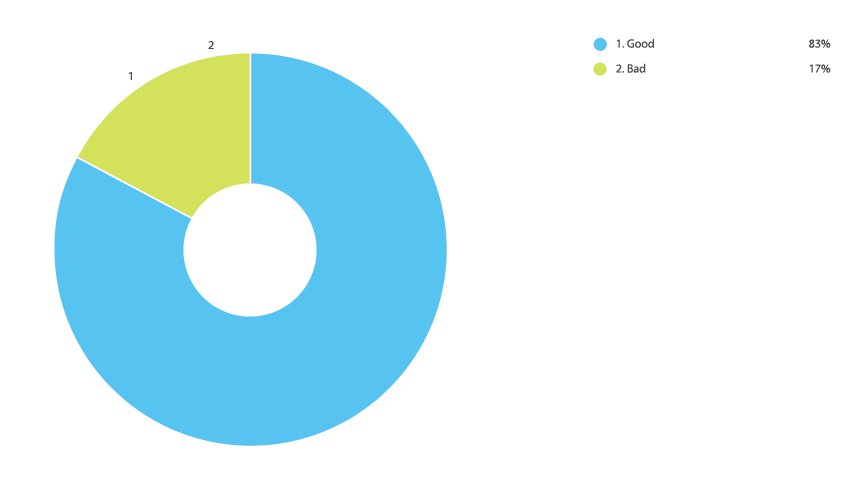
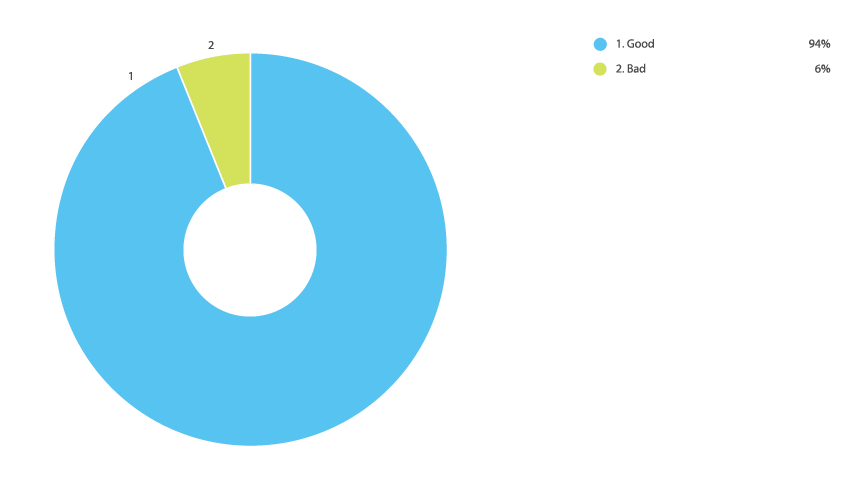
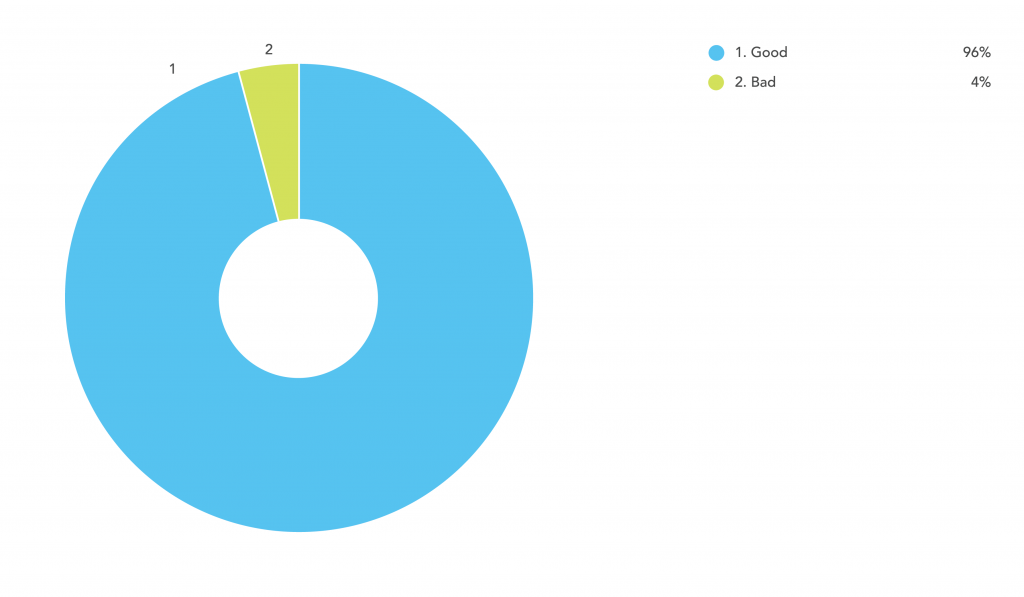
Percentage Delivered Good vs Bad
A slight increase in quality from last quarter. Bad orders were re-made and re-shipped for free, with no pesky returns necessary:
Speed
Most Used Making Speeds
A slight drop in speed upgrades compared to last quarter, which is to be expected with fewer holiday projects that have the need for speed.
Percentage Delivered On-Time vs Late
Late orders are up again this quarter, nearly twice as high as the same time last year. Looks like it’s time to for production to get more of a hurry on:
Geography
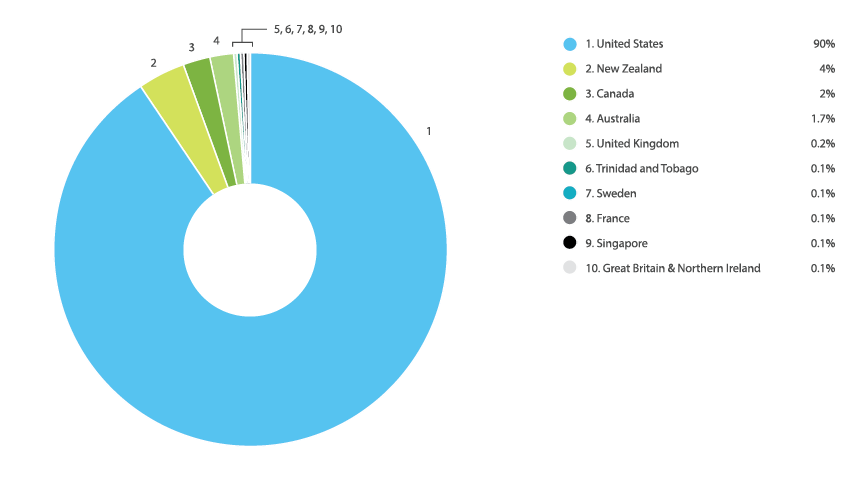
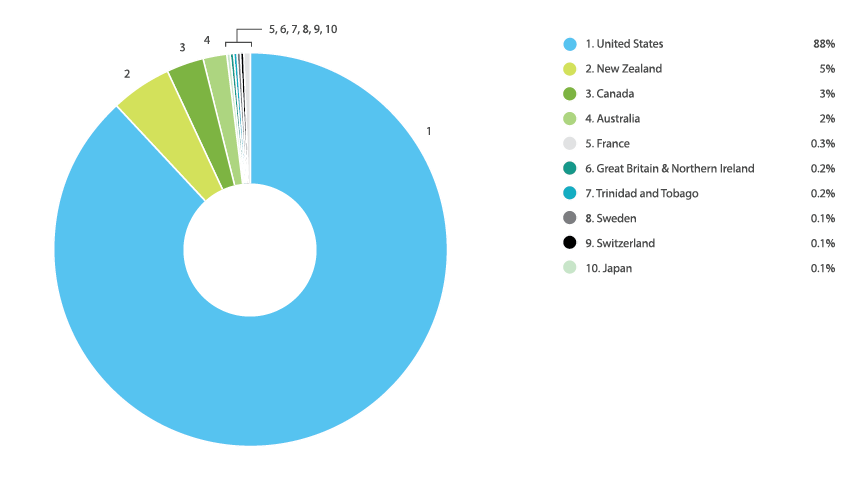
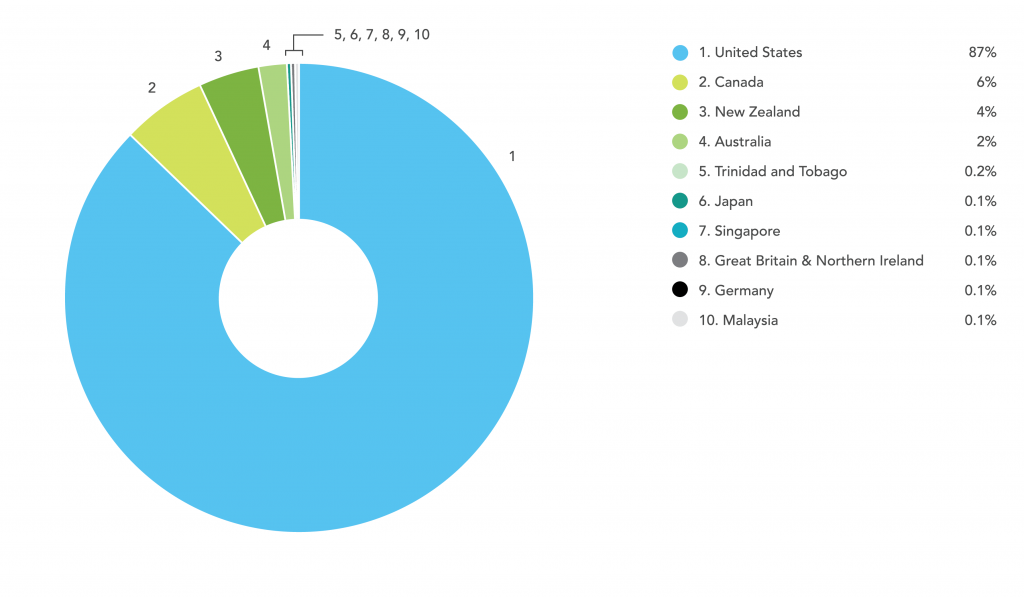
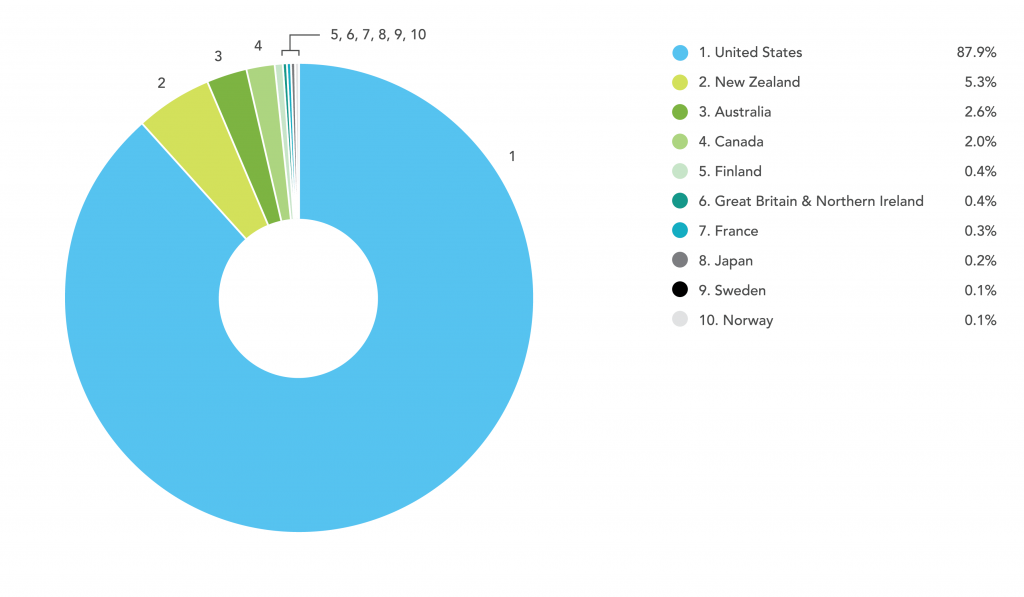
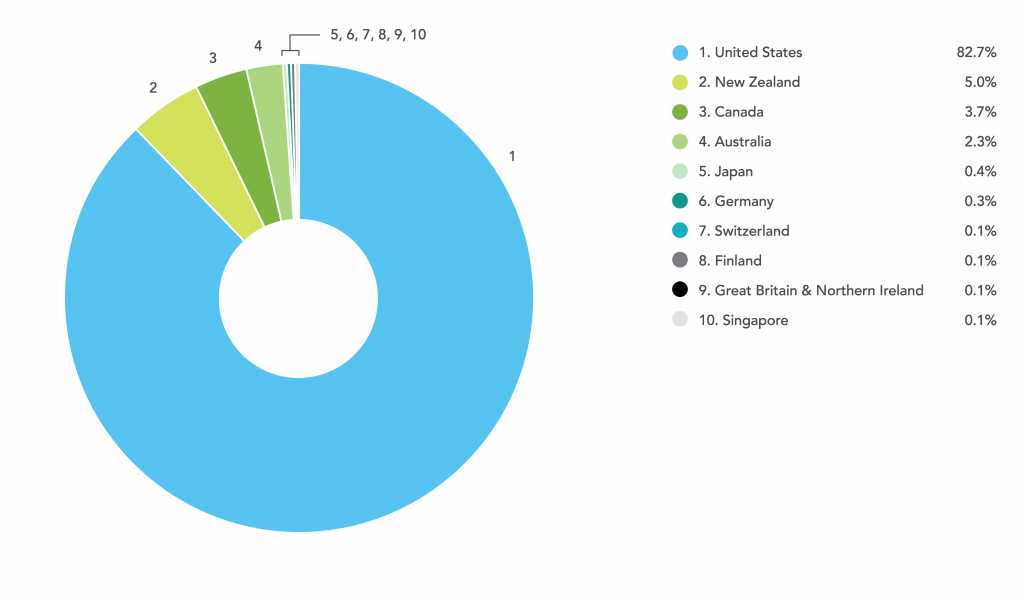
Top Laser Cutting Countries
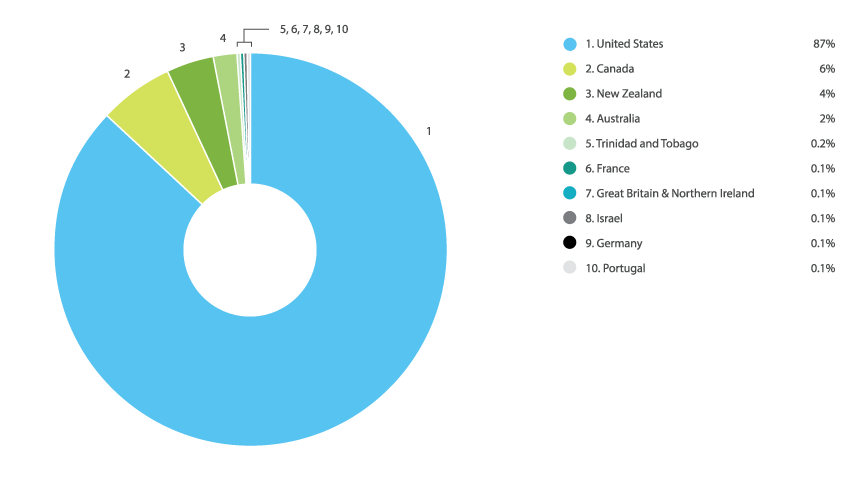
Canada jumps to number two, taking New Zealand back down to number three. Trinidad and Tobago enters at number five, and Malaysia takes the last spot. Japan enters at number six and Finland, Sweden, France and Norway all leave the top 10. Great Britain & Northern Ireland rejoin the top 10 at number eight.
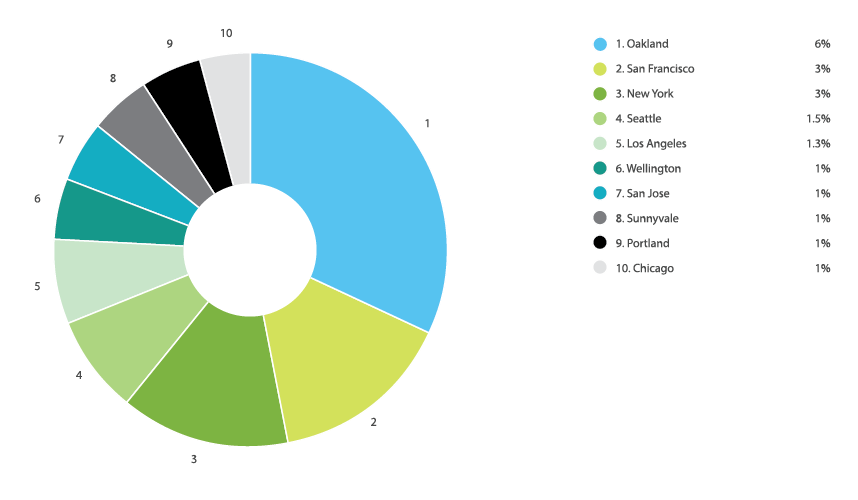
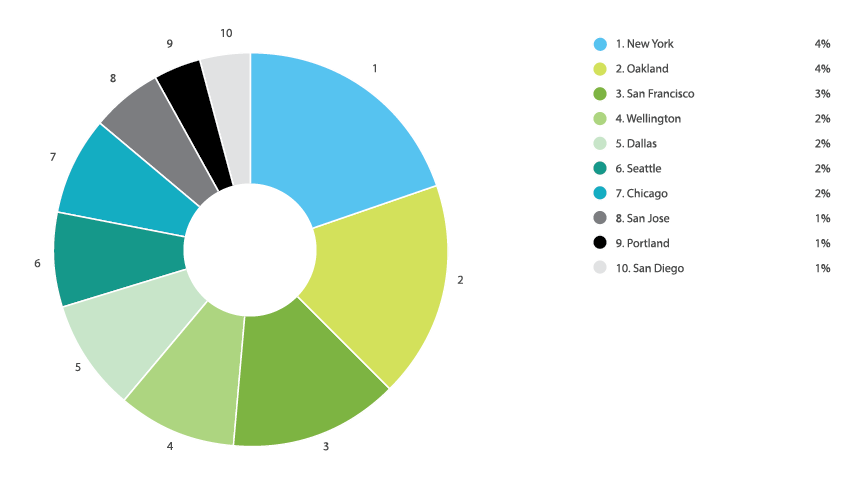
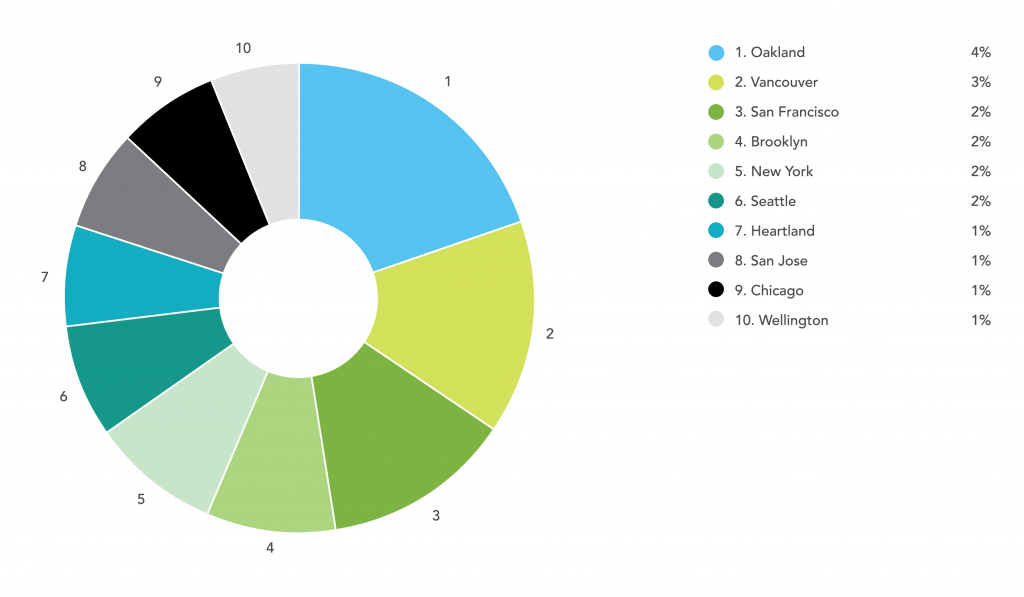
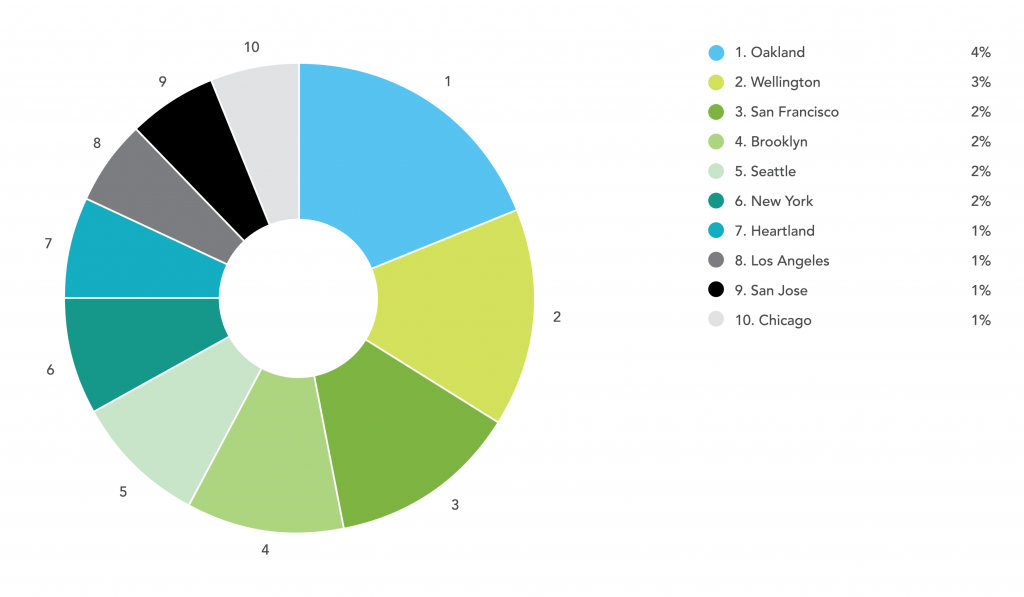
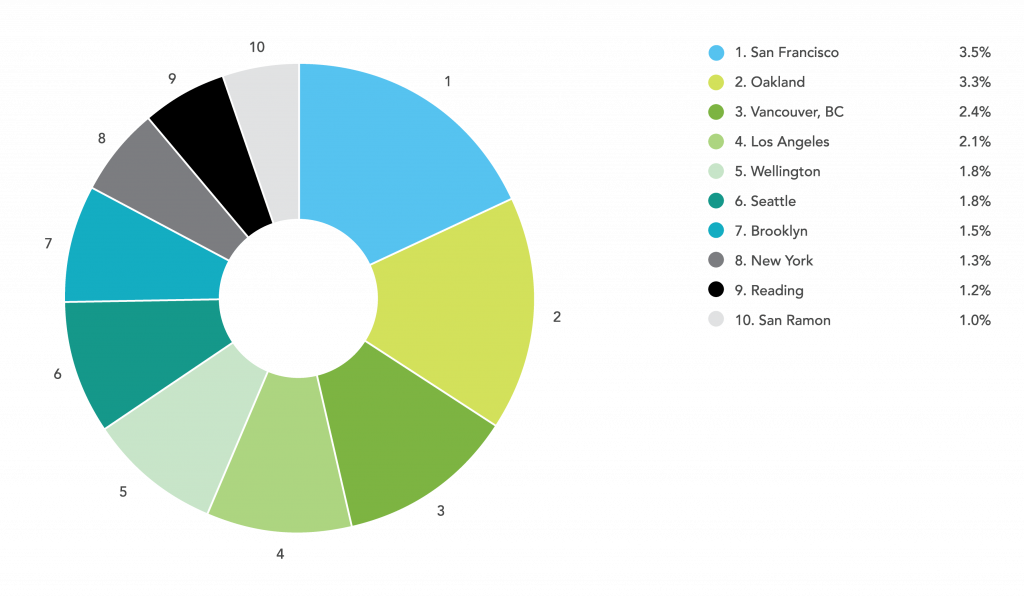
Top Laser Cutting Cities
Vancouver jumps a spot from number three to number two, pushing San Francisco down to third. Heartland and San Jose are added to the top 10, with Portland and Los Angeles dropping off. Wellington moves all the way down from number five to 10.
What’s Next?
This was our first report for 2019. You can view the previous quarters below. The most interesting change we saw recently was the increase in orders from Trinidad and Tobago and the reduction in speeds required. As before, please let us know what other information you’d like included in future editions.
Online Laser Cutting Trend Report – Q4 2018
This quarterly report is for customers, suppliers and digital manufacturing industry trends analysts to learn more about online laser cutting.
It’s the only report of its kind, with real world data from Ponoko, an online laser cutting pioneer visited by 1,000,000 people per year.
This is our fourth report for 2018, so let’s see what’s changed:
Laser Technique
Most Used Laser Technique
Both types of engraving were more popular than last quarter, softening cutting a little more.
Materials
Most Used Categories
Plastic took a slight dip in popularity due to the increasing use of wood at number two. Leather dropped down to seventh place and foam dropped off the list.
Most Used Kinds
Veneer MDF jumped to fifth place and premium Veneer MDF dropped down to number eight. Cardstock is back on the board, and we’ve said goodbye to corrugated cardboard from the top 10 this quarter.
Most Used Sheet Thicknesses
As usual, 3.0 mm is dominating in first place, but 2.0 mm drops back down to seventh. Featuring at ninth place, 6.2 mm is back on the board and 0.5 mm leaves the top 10.
Most Used Colors
Though still a clear favourite, clear softens a little. Birch bounces back up to number three, knocking Amber three-ply down to number nine. Maple leaves the top 10 with Amber jumping onto the board in fourth place (hello Bamboo Plywood).
Software
Most Used Design Software Tools
Adobe Illustrator is consistently the favorite, but this quarter its usage is up and CAD usage is down.
Quality
Percentage Delivered Good vs Bad
A slight drop in quality from last quarter. Bad orders were re-made and re-shipped for free, with no pesky returns necessary:
Speed
Most Used Making Speeds
A slight increase in three-day and one-day making speeds this quarter, which isn’t surprising with the holidays:
Percentage Delivered On-Time vs Late
Late orders were down from last quarter, but still higher than earlier in the year:
Geography
Top Laser Countries
Canada is back at third place. Great Britain and Japan were pushed out of the top 10 by Singapore and Switzerland at fifth and seventh place, respectively.
Top Laser Cities
Vancouver is back in the game at third place and Wellington drops down to fifth. Portland enters at ninth place with Heartland and San Jose leaving the top 10 cities.
What’s Next?
This was our final report for 2018. You can view the previous quarters below. The most interesting changes we saw were the increase in orders from Singapore and the increase in engraving (must be all those customized Christmas details). As before, please let us know what other information you’d like included in future editions.

Online Laser Cutting Trend Report – Q3 2018
This quarterly report is for customers, suppliers and digital manufacturing industry trends analysts to learn more about online laser cutting.
It’s the only report of its kind, with real world data from Ponoko, an online laser cutting pioneer visited by 1,000,000 people per year.
This is our third report, so let’s see what’s changed:
Laser Technique
Most Used Laser Technique
Area engraving had its first lift in usage this year, with laser cutting softening a tiny amount:
Materials
Most Used Categories
While paper beat out leather for fourth place, metal doubled in presence and foam made its first appearance:
Most Used Kinds
Bamboo re-took second place, premium veneer MDF jumped two places into fifth for the first time, hardwood made its debut in eighth place, with corrugated cardboard pushed from fifth to tenth position:
Most Used Sheet Thicknesses
It appears 3mm is not going to lose its title any time soon, with 2mm jumping from sixth to fourth, and 6.7mm debuting at ninth slot:
Most Used Colors
Clear hit its highest #1 ranking yet, amber blows out birch for third spot, and maple says hello for the first time in tenth position:
Software
Most Used Design Software Tools
No change in positions, but AutoCAD usage jumped up by 57%:
Quality
Percentage Delivered Good vs Bad
Pleasing to see quality improved just a little. And as always, all bad orders were re-made and re-shipped for free, with no pesky returns necessary:
Speed
Most Used Making Speeds
You were more relaxed on time frames in Q3 than any previous quarter of the year to date:
Percentage Delivered On-Time vs Late
One of the largest Q3 changes was a 119% jump in late orders. Of course, all paid late orders were refunded. And some public floggings were at least dreamed of:
Geography
Top Laser Countries
Australia pushed Canada out of third spot for the first time, Finland (debuting at eighth spot last quarter) moved up to fifth, Great Britain regained its sixth position, France and Norway pushed out Germany and Singapore, and Switzerland fought back against Sweden:
Top Laser Cities
The third quarter has a third new title holder as the world’s digital making epicenter with Oakland CA pushing out San Francisco (and Vancouver BC before that and not in the top 10 at all this time). In other news, NYC has gone from tenth to eighth to sixth, while Reading was pushed out of the top 10:
What’s Next?
This was our third report for the year. You can view the other two below. There were a few changes between quarters. Noticeably a jump in late orders and Vancouver BC not making the top 10 digital making centers although it was in first place during Q1. As before, please let us know what other information you’d like included in future editions.
Online Laser Cutting Trend Report – Q2 2018
This quarterly report is for customers, suppliers and digital manufacturing industry trends analysts to learn more about online laser cutting.
It’s the only report of its kind, with real world data from Ponoko, an online laser cutting pioneer visited by 1,000,000 people per year.
Let’s kick into our first update to see what’s changed:
Laser Technique
Most Used Laser Technique
Laser cutting was even more prominent in Q2:
Materials
Most Used Categories
Plastic and wood continued to lead the way, with rubber and metal subsiding a little:
Most Used Kinds
Acrylic was even more popular this last quarter, Peel & Stick Veneer makes a top 10 appearance for the first time:
Most Used Sheet Thicknesses
3mm reigned supreme once more, with 0.5mm making its debut (hello Peel & Stick Veneer):
Most Used Colors
No change at the top with clear and black, but grey tint pushes blonde into the tenth spot:
Software
Most Used Design Software Tools
No change but AutoCAD was a little more popular:
Quality
Percentage Delivered Good vs Bad
No change. All bad orders were re-made and re-shipped for free, with no pesky returns necessary:
Speed
Most Used Making Speeds
We were in a bit more of a hurry during Q2 than during Q1:
Percentage Delivered On-Time vs Late
No change. All paid late orders were refunded:
Geography
Top Laser Countries
USA continued as the world’s digital making capital, while Switzerland pushed out Sweden:
Top Laser Cities
San Francisco lept four places to take out the title of the world’s digital making epicenter, while San Ramon, CA pushed Chicago off the list:
What’s Next?
This was our first update on the inaugural report below. There were a few changes between quarters. Noticeably San Francisco pushing Vancouver BC aside as the center for digital making. As before, please let us know what other information you’d like included in future editions.
Online Laser Cutting Trend Report – Q1 2018
This quarterly report is for customers, suppliers and digital manufacturing industry trends analysts to learn more about online laser cutting.
It’s the only report of its kind, with real world data from Ponoko, an online laser cutting pioneer visited by 1,000,000 people per year.
Let’s kick into it:
Laser Technique
Most Used Laser Technique
It’s not generally known as laser cutting for no reason: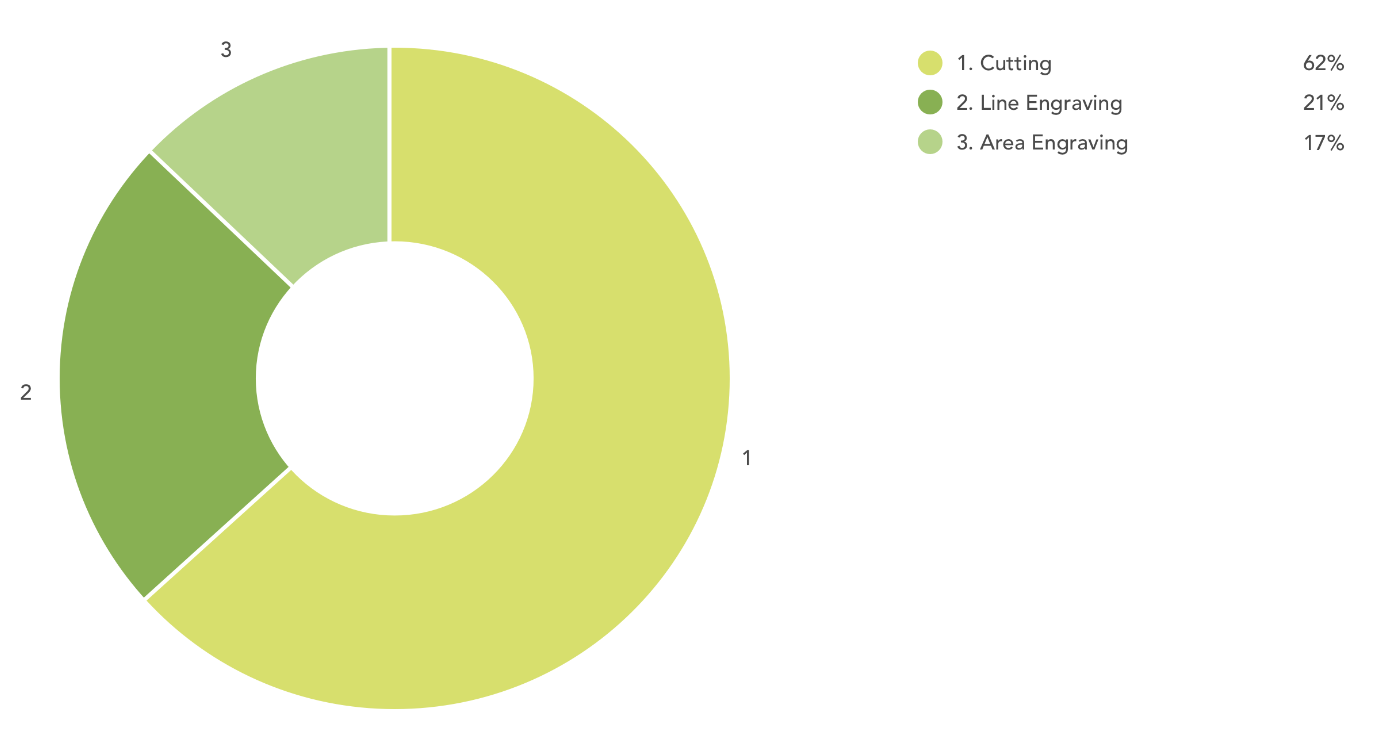
Materials
Most Used Categories
A variety of organic materials featured, led by plastic and wood: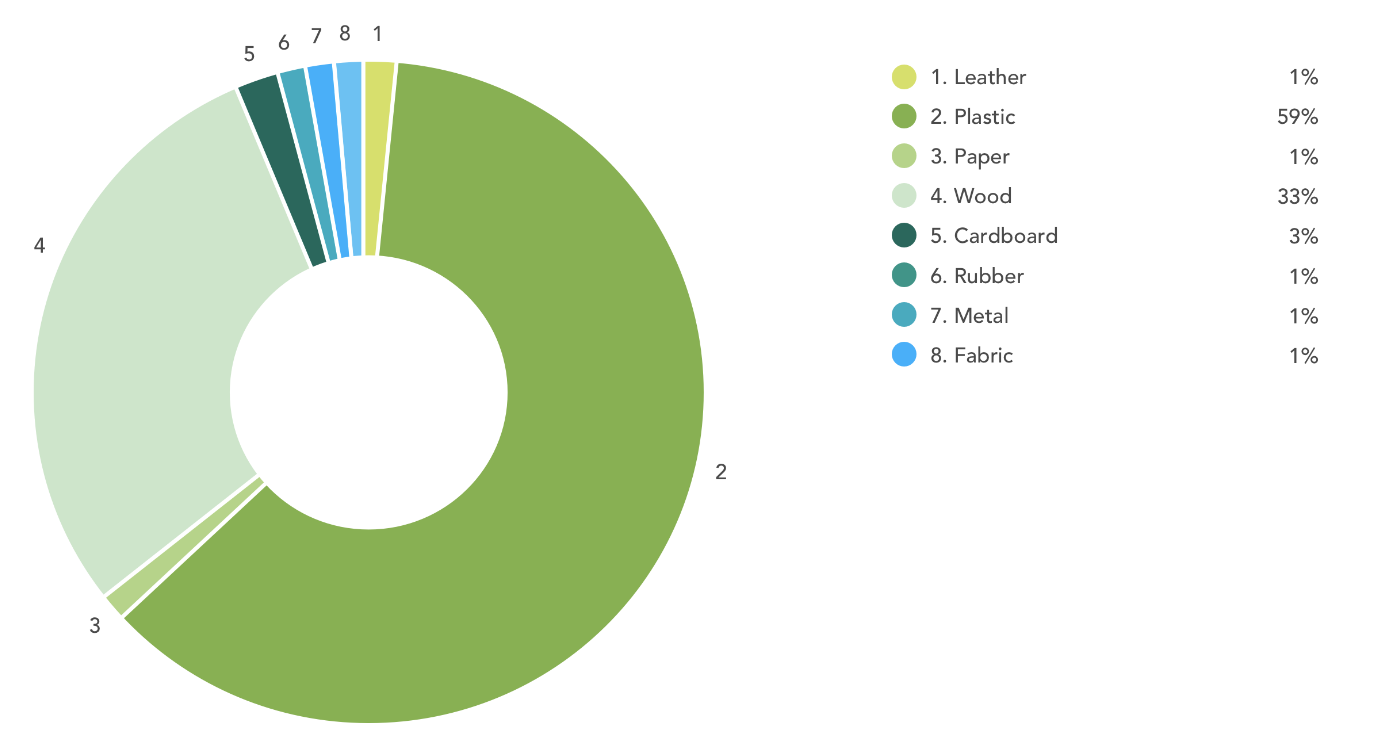
Most Used Kinds
Acrylic was the hands down favorite: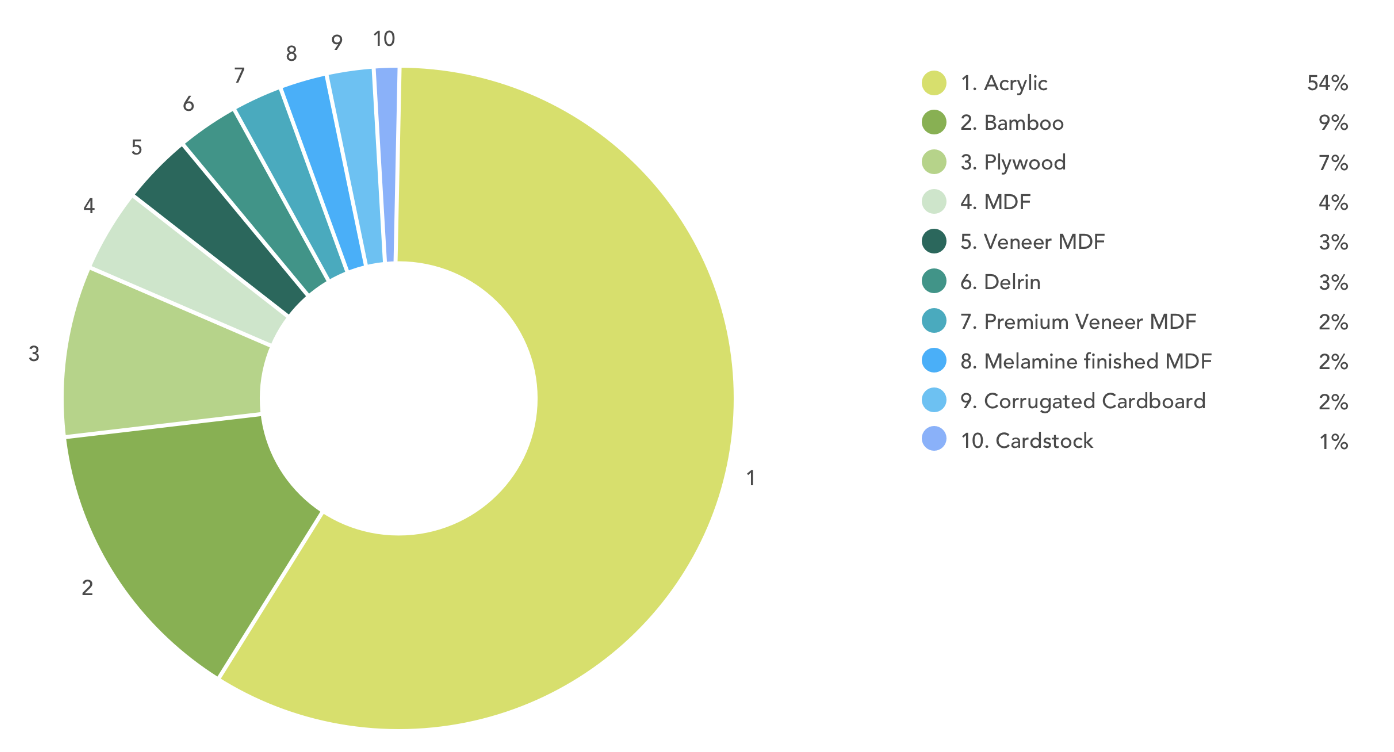
Most Used Sheet Thicknesses
The humble 3mm material sheet was the versatile winner: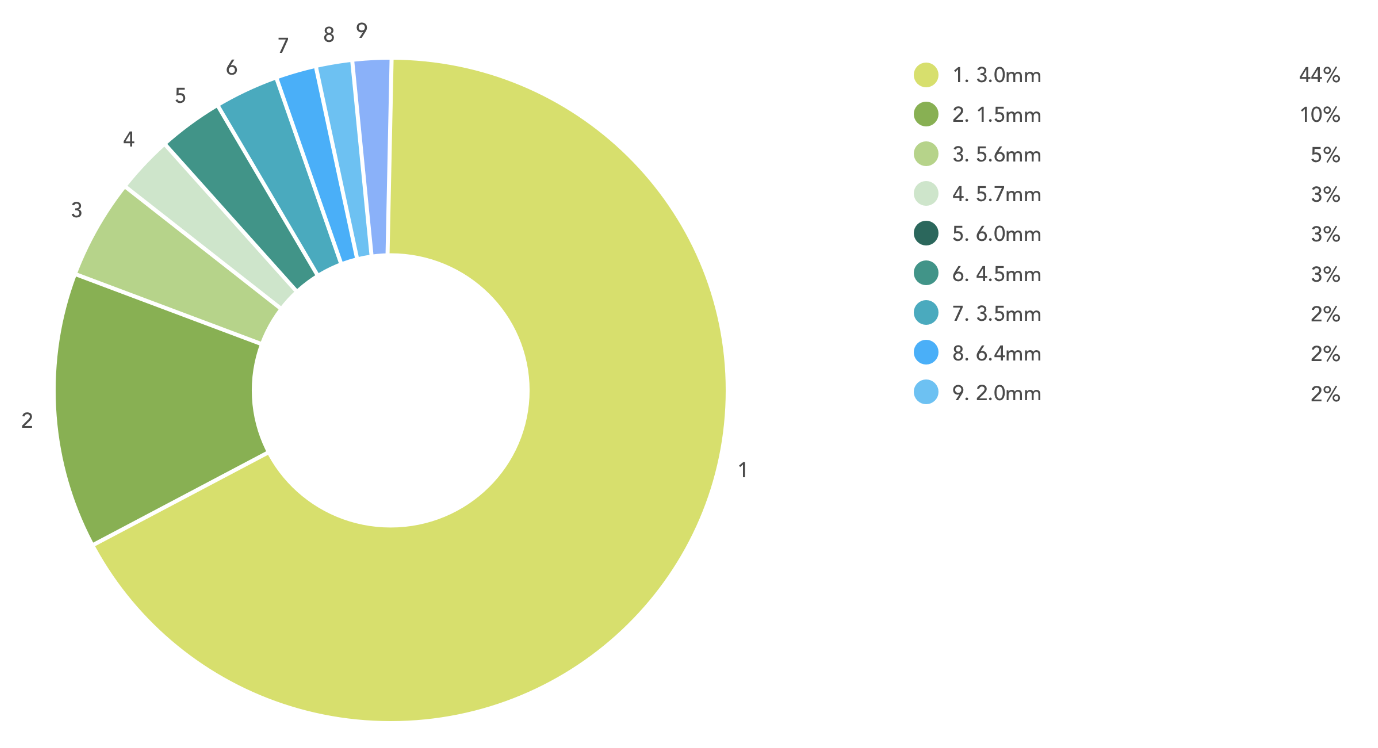
Most Used Colors
There was no escaping the safe colors of clear and black: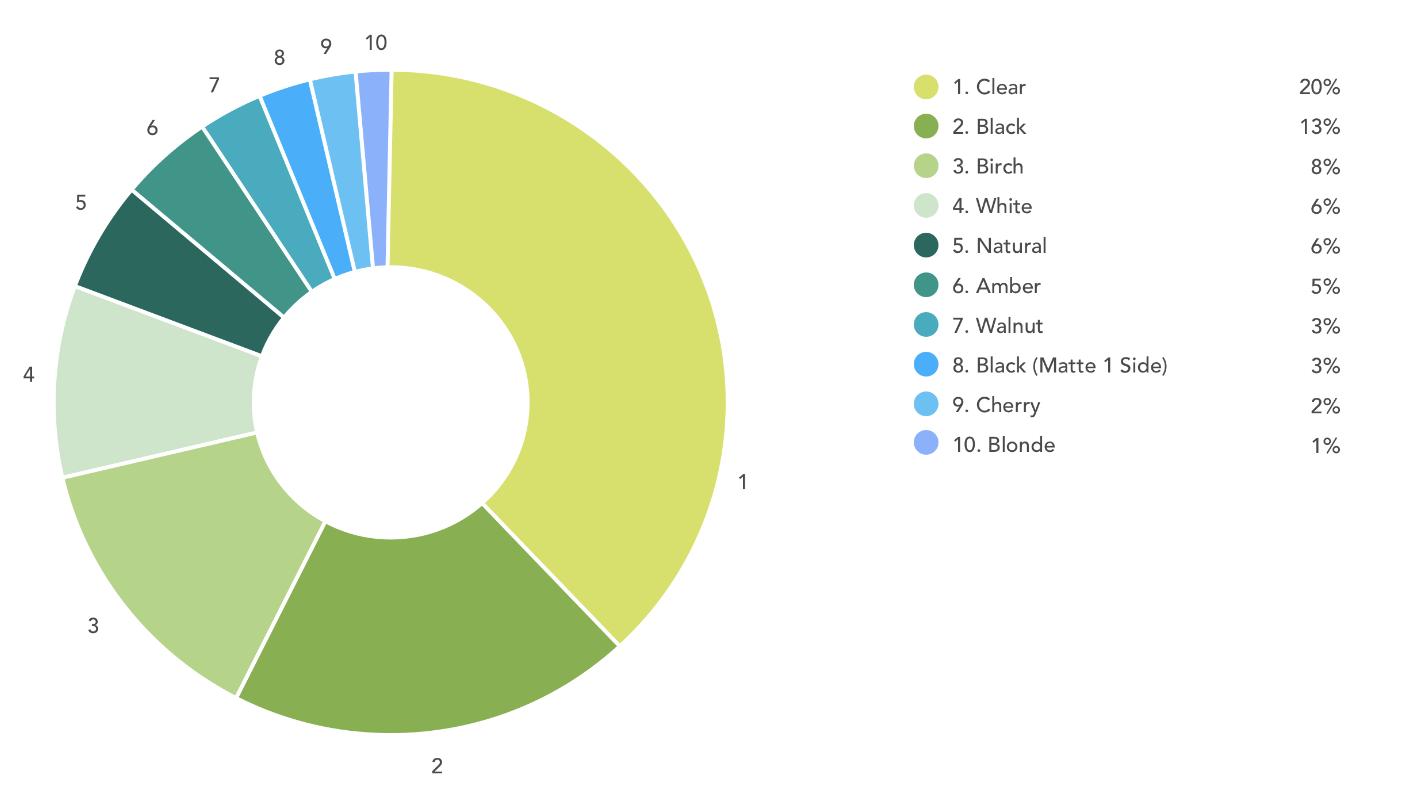
Software
Most Used Design Software Tools
Hello AI fans: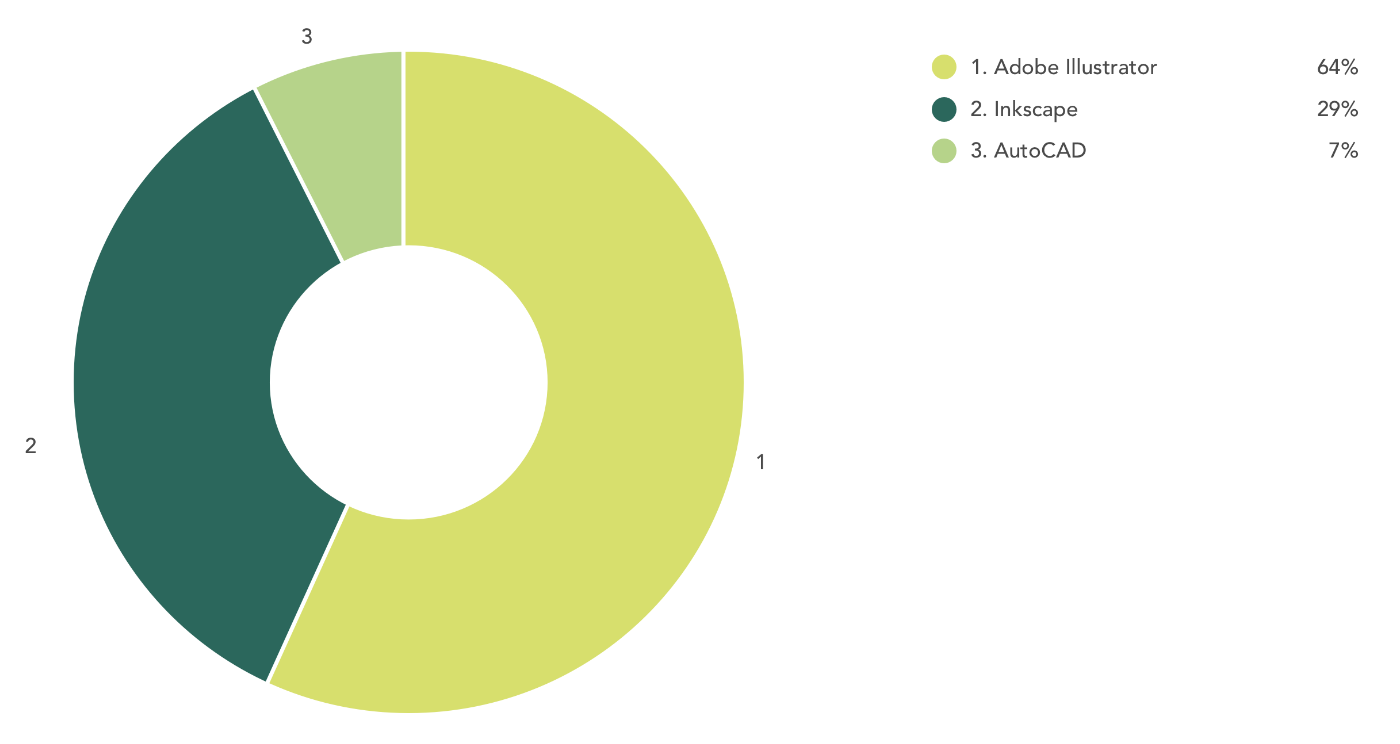
Quality
Percentage Delivered Good vs Bad
All bad orders were re-made and re-shipped for free, with no pesky returns necessary: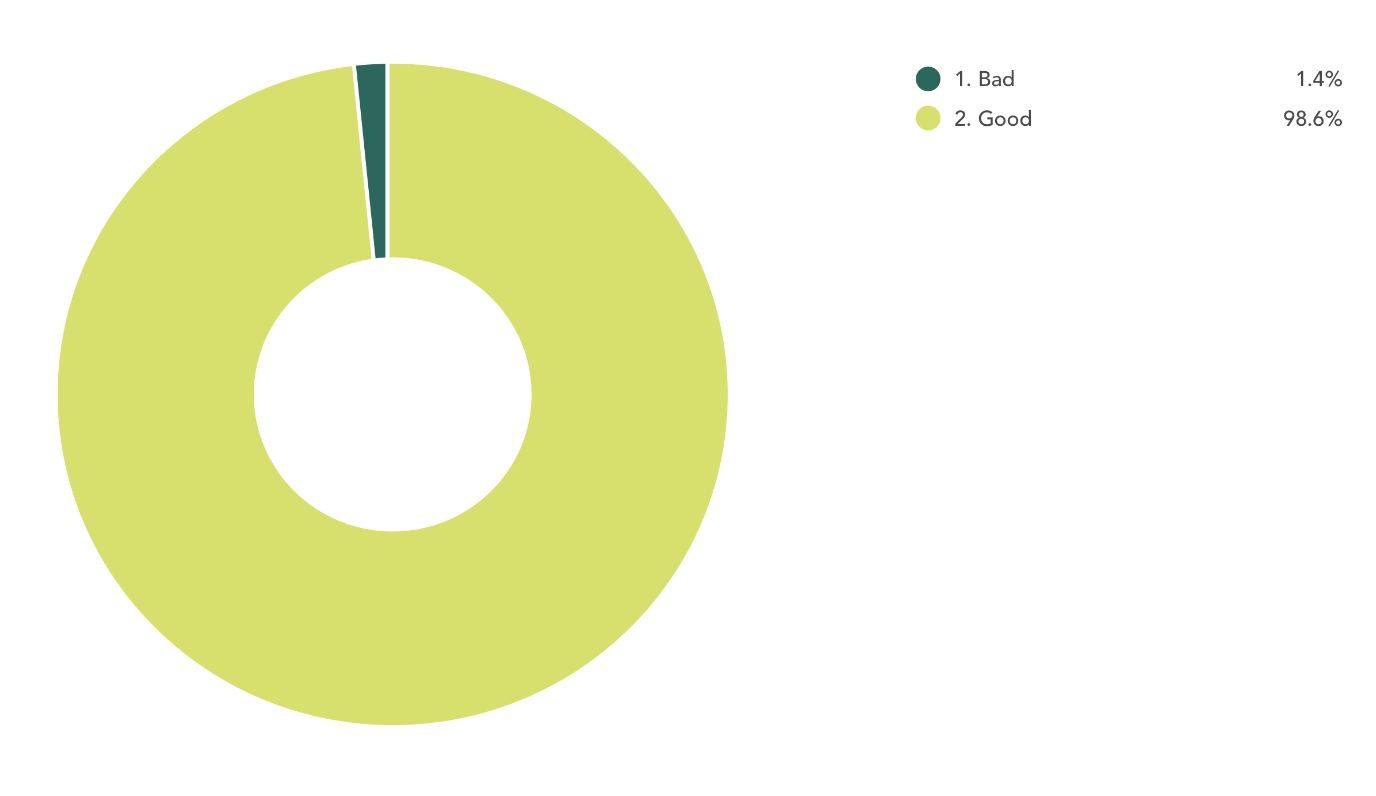
Speed
Most Used Making Speeds
About half of us were in a hurry, while the other half of us were chilled: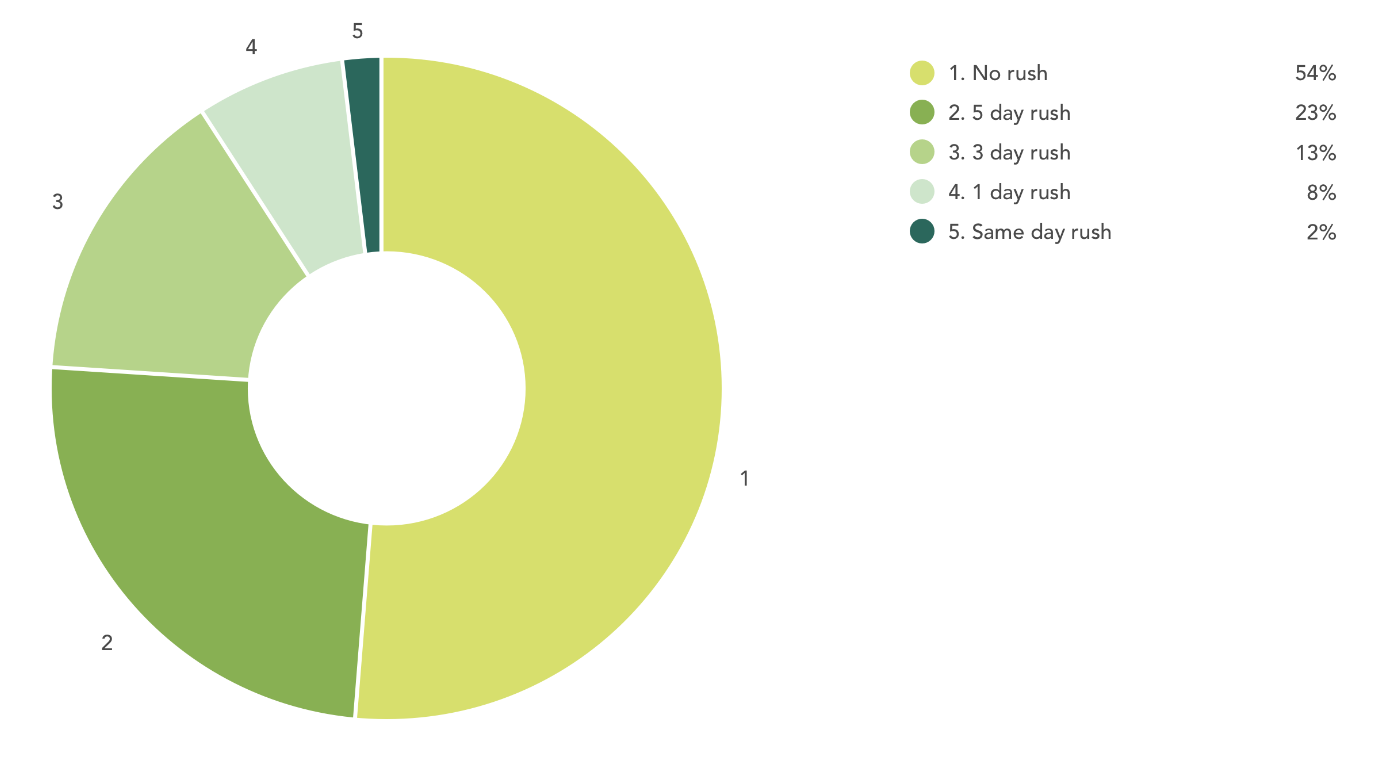
Percentage Delivered On-Time vs Late
All paid late orders were refunded: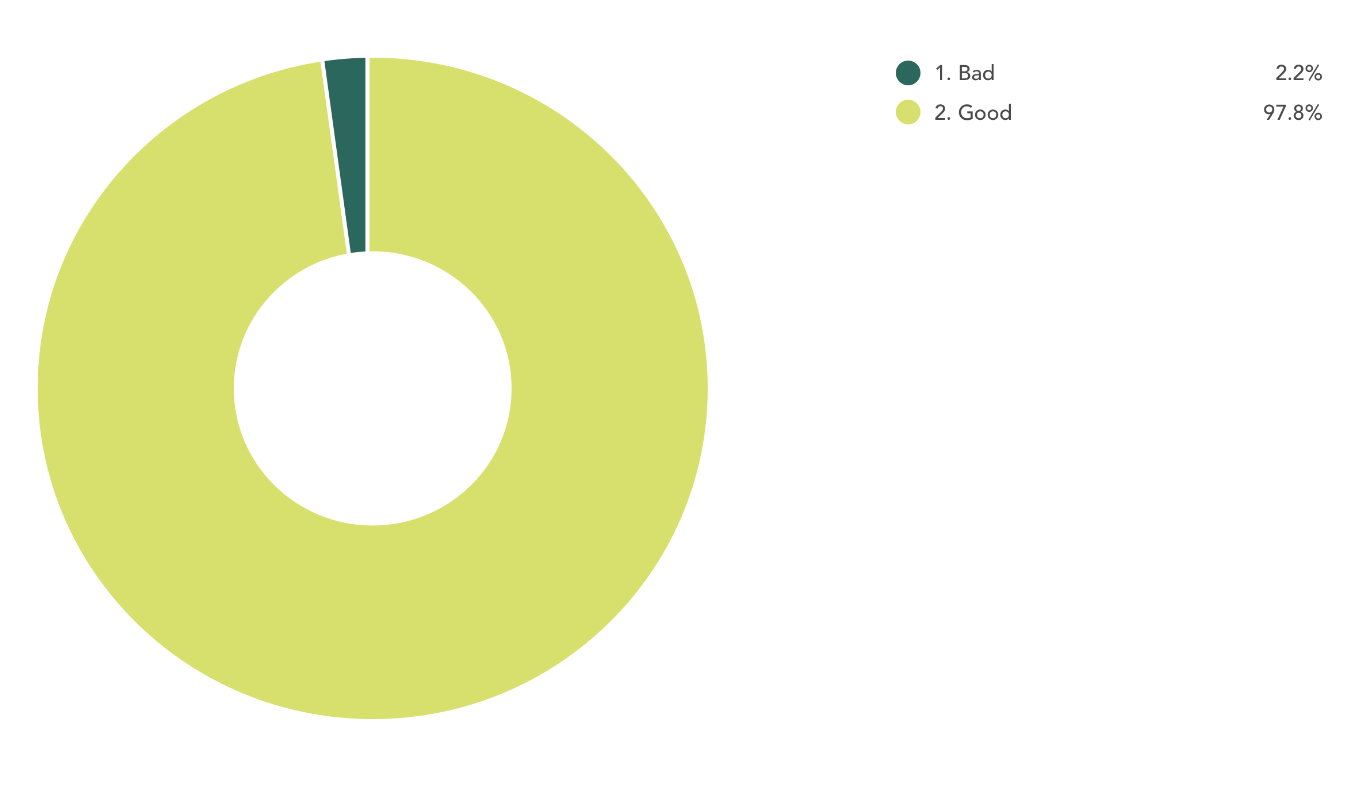
Geography
Top Laser Countries
USA was the world’s digital making capital: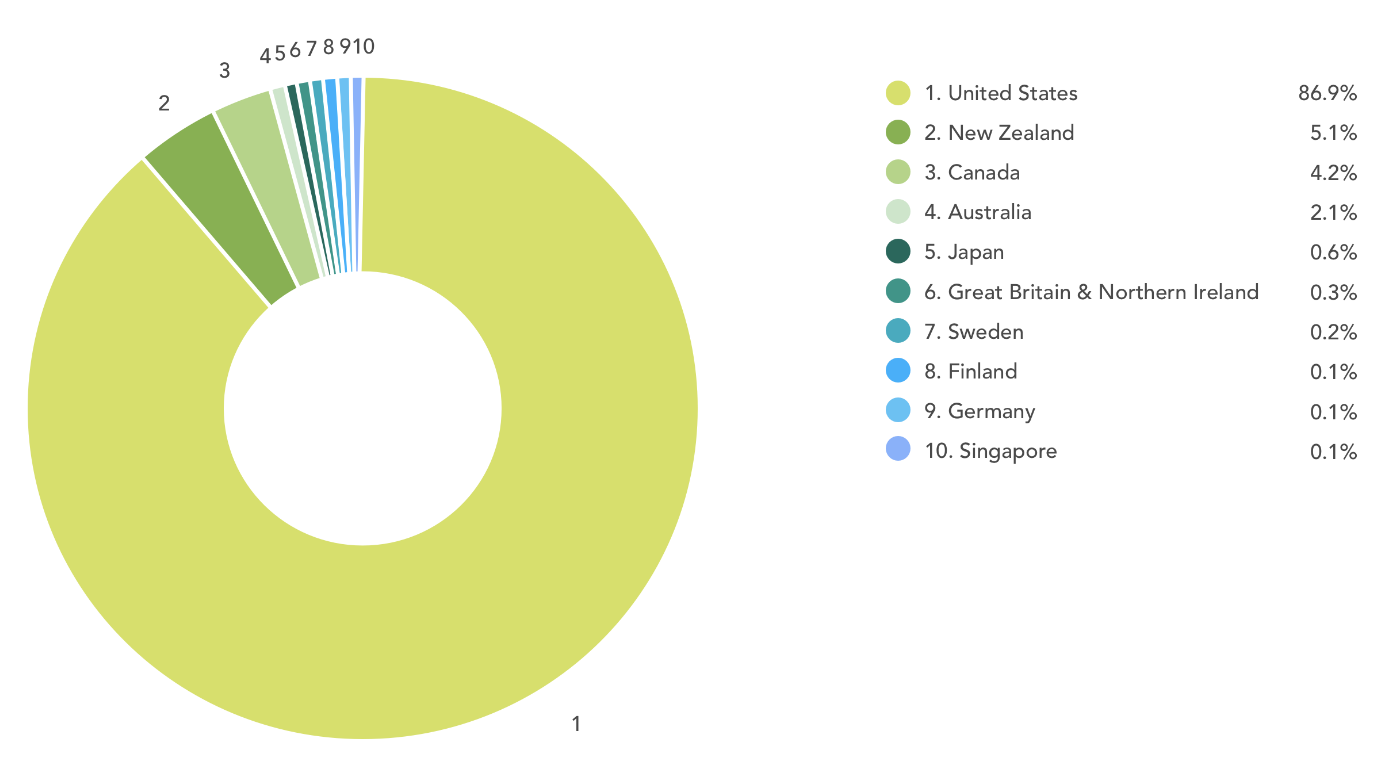
Top Laser Cities
Vancouver, BC was the world’s digital making epicenter: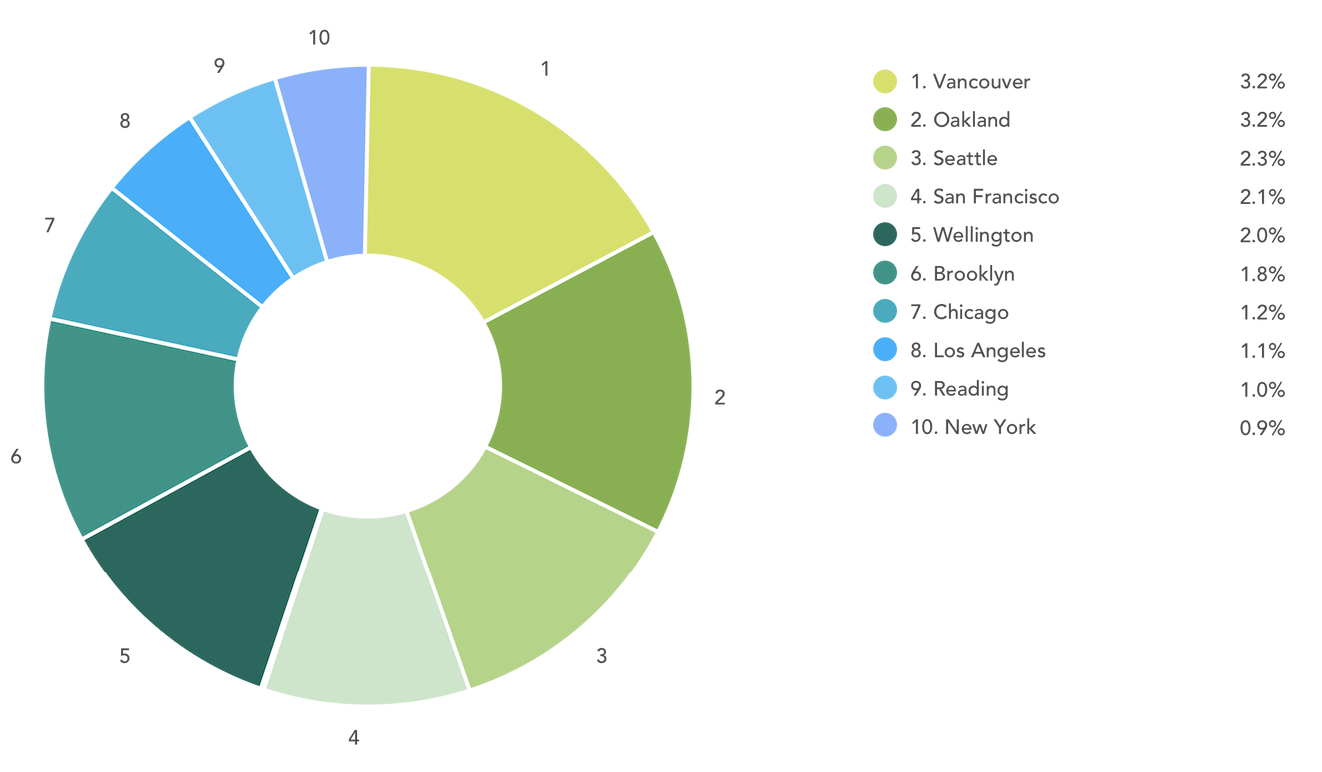
(Hat tip to 3D Hubs).
What’s Next?
We’re just getting started. Please let us know what other information you’d like included in future editions.
1 Comment
I’m interested in what the wattage of the laser tube is being used,
from highest percentage to lowest percentage,
and listed for each country.
(also the wattage of the laser tube should be determined by taking the length of the laser tube and the diameter of the laser tube to determine the wattage of the reported laser tube)
This might require a standard chart showing the length, diameter, rated power, max power.
Comments are closed.